Creating and downloading a shapefile from simplyanalytics.com
This walkthrough shows how to (1) sign in, (2) build a map view for a location and geography, and (3) export that geography as a shapefile with up to 10 appended data variables.
Prerequisites
- Access to your institution’s SimplyAnalytics instance (e.g., Stanford’s).
- A project/view already started or you’re ready to create a new one.
- An email address you can receive downloads at (exports are delivered by email).
1) Sign in
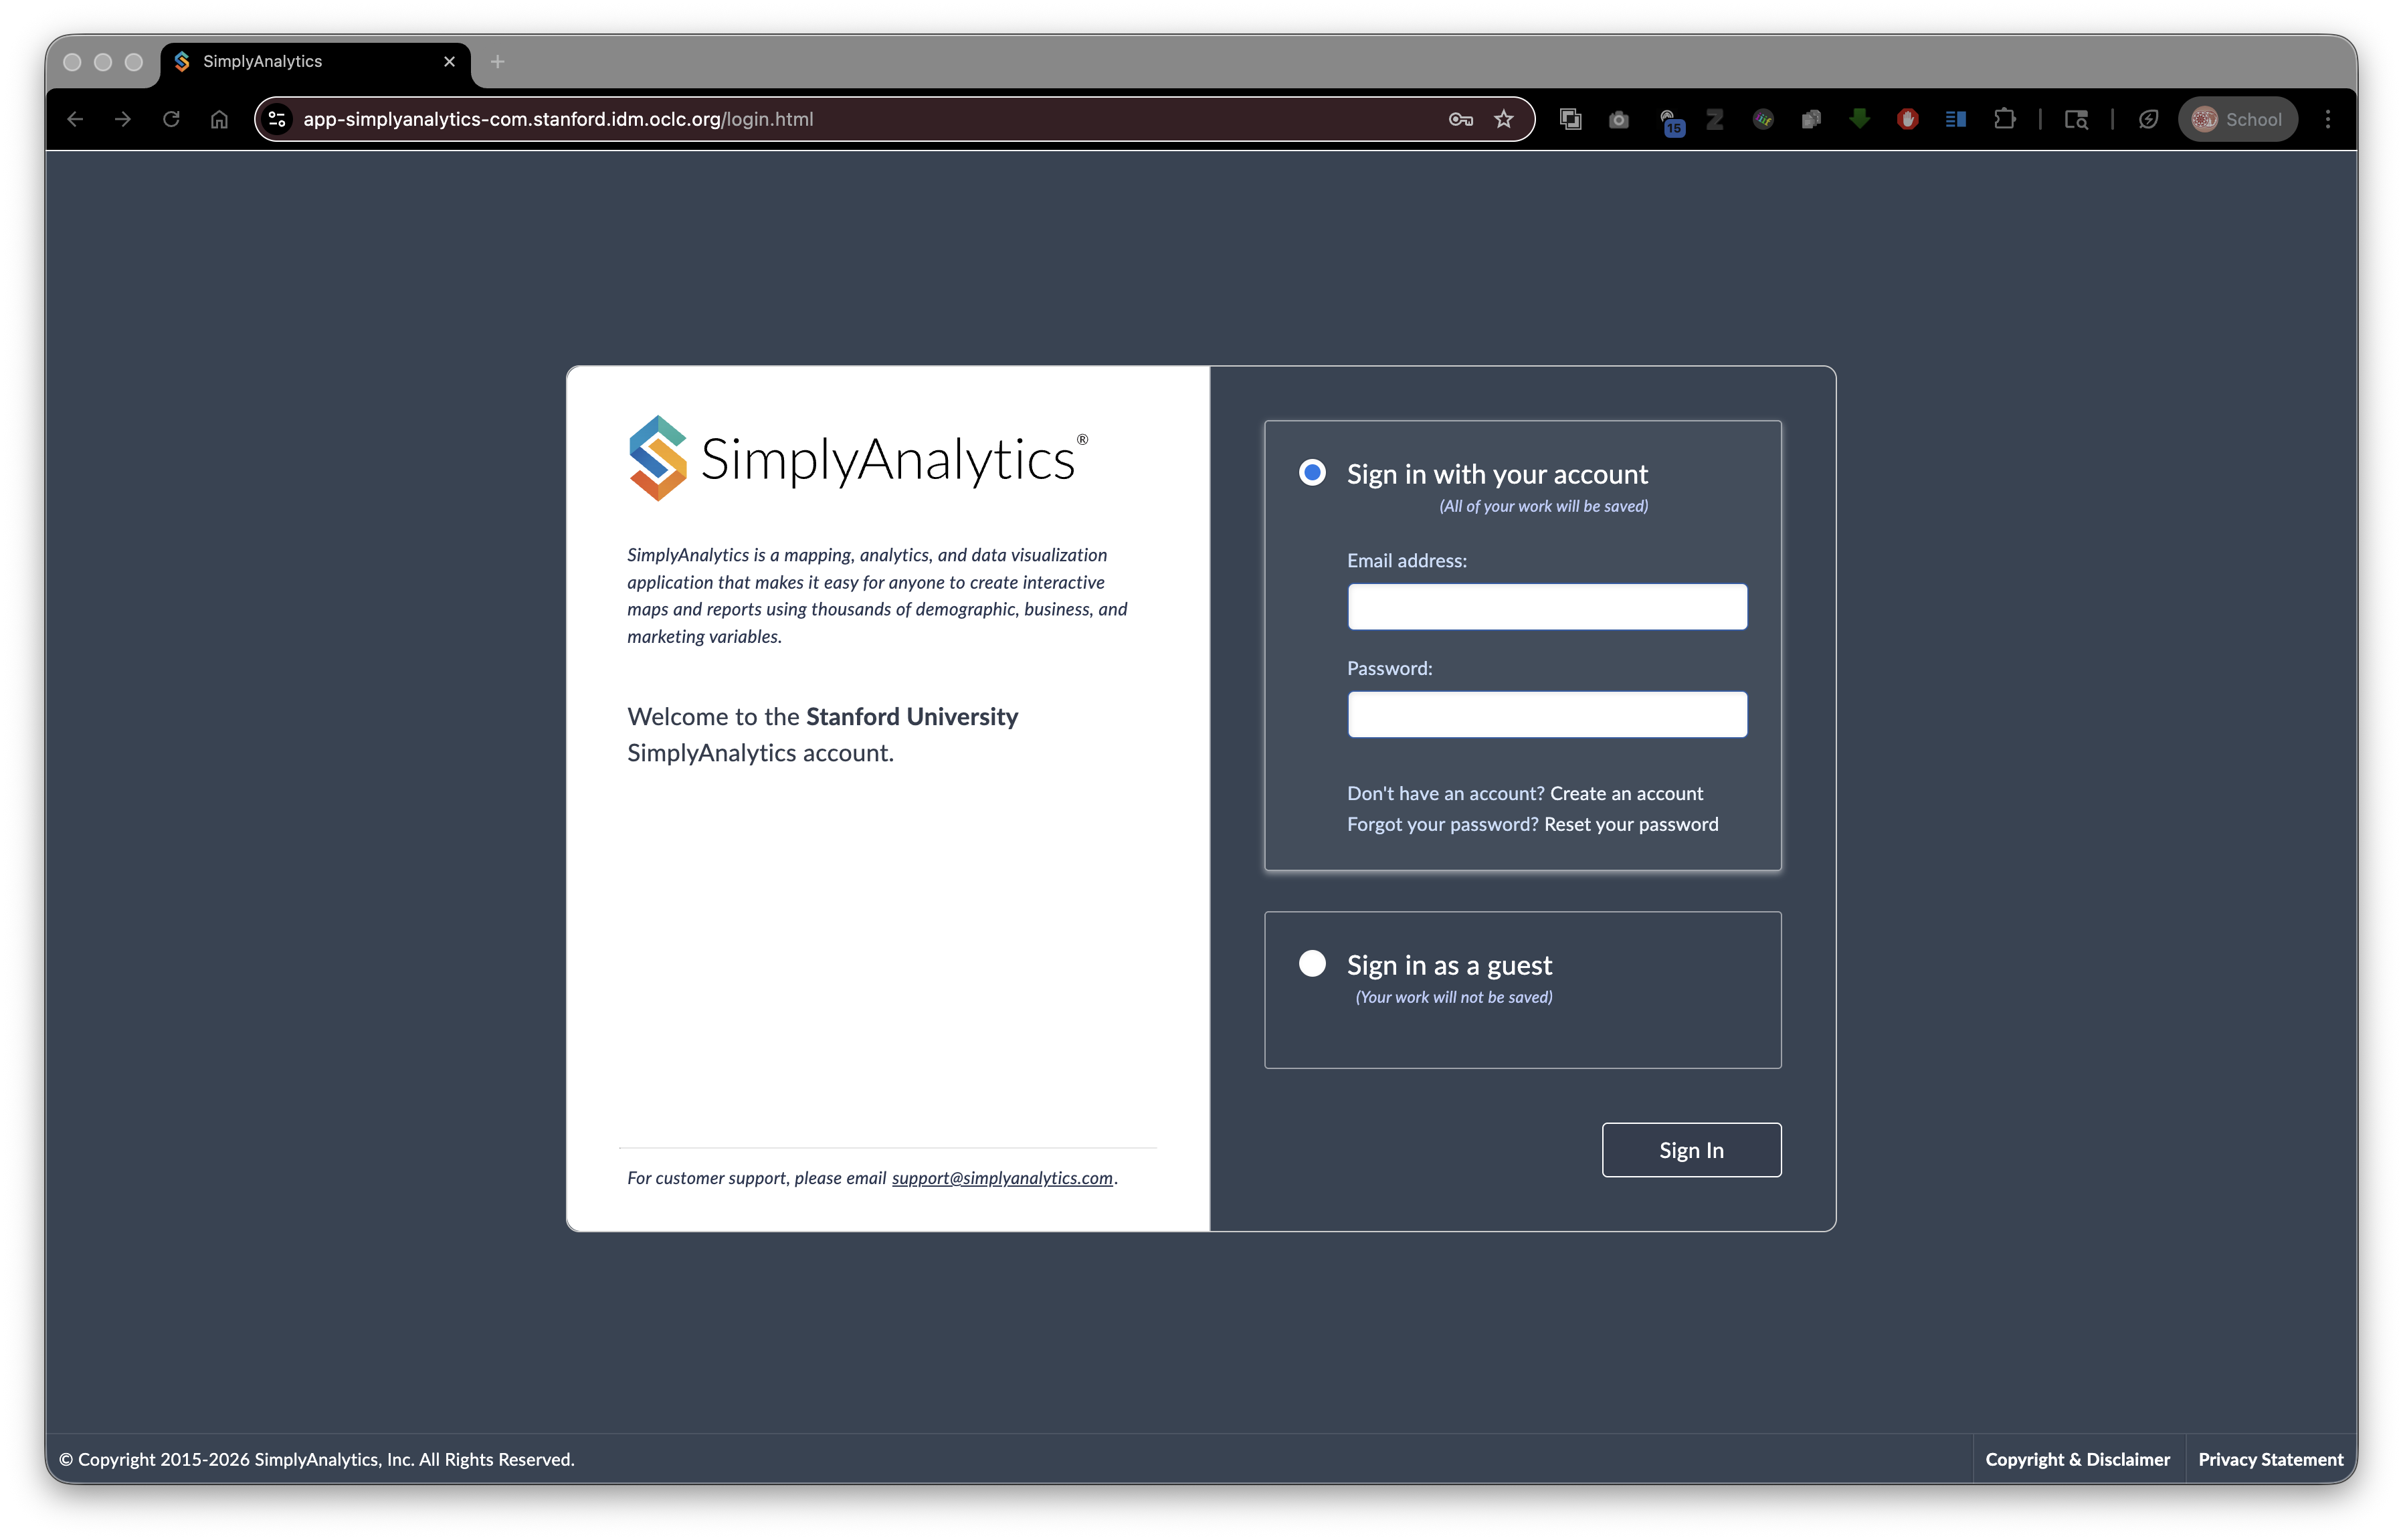
- Open your institution’s SimplyAnalytics login page.
- Choose Sign in with your account and enter your credentials.
- Click Sign In.
2) Start a new project
- In the top menu bar, click New Project.
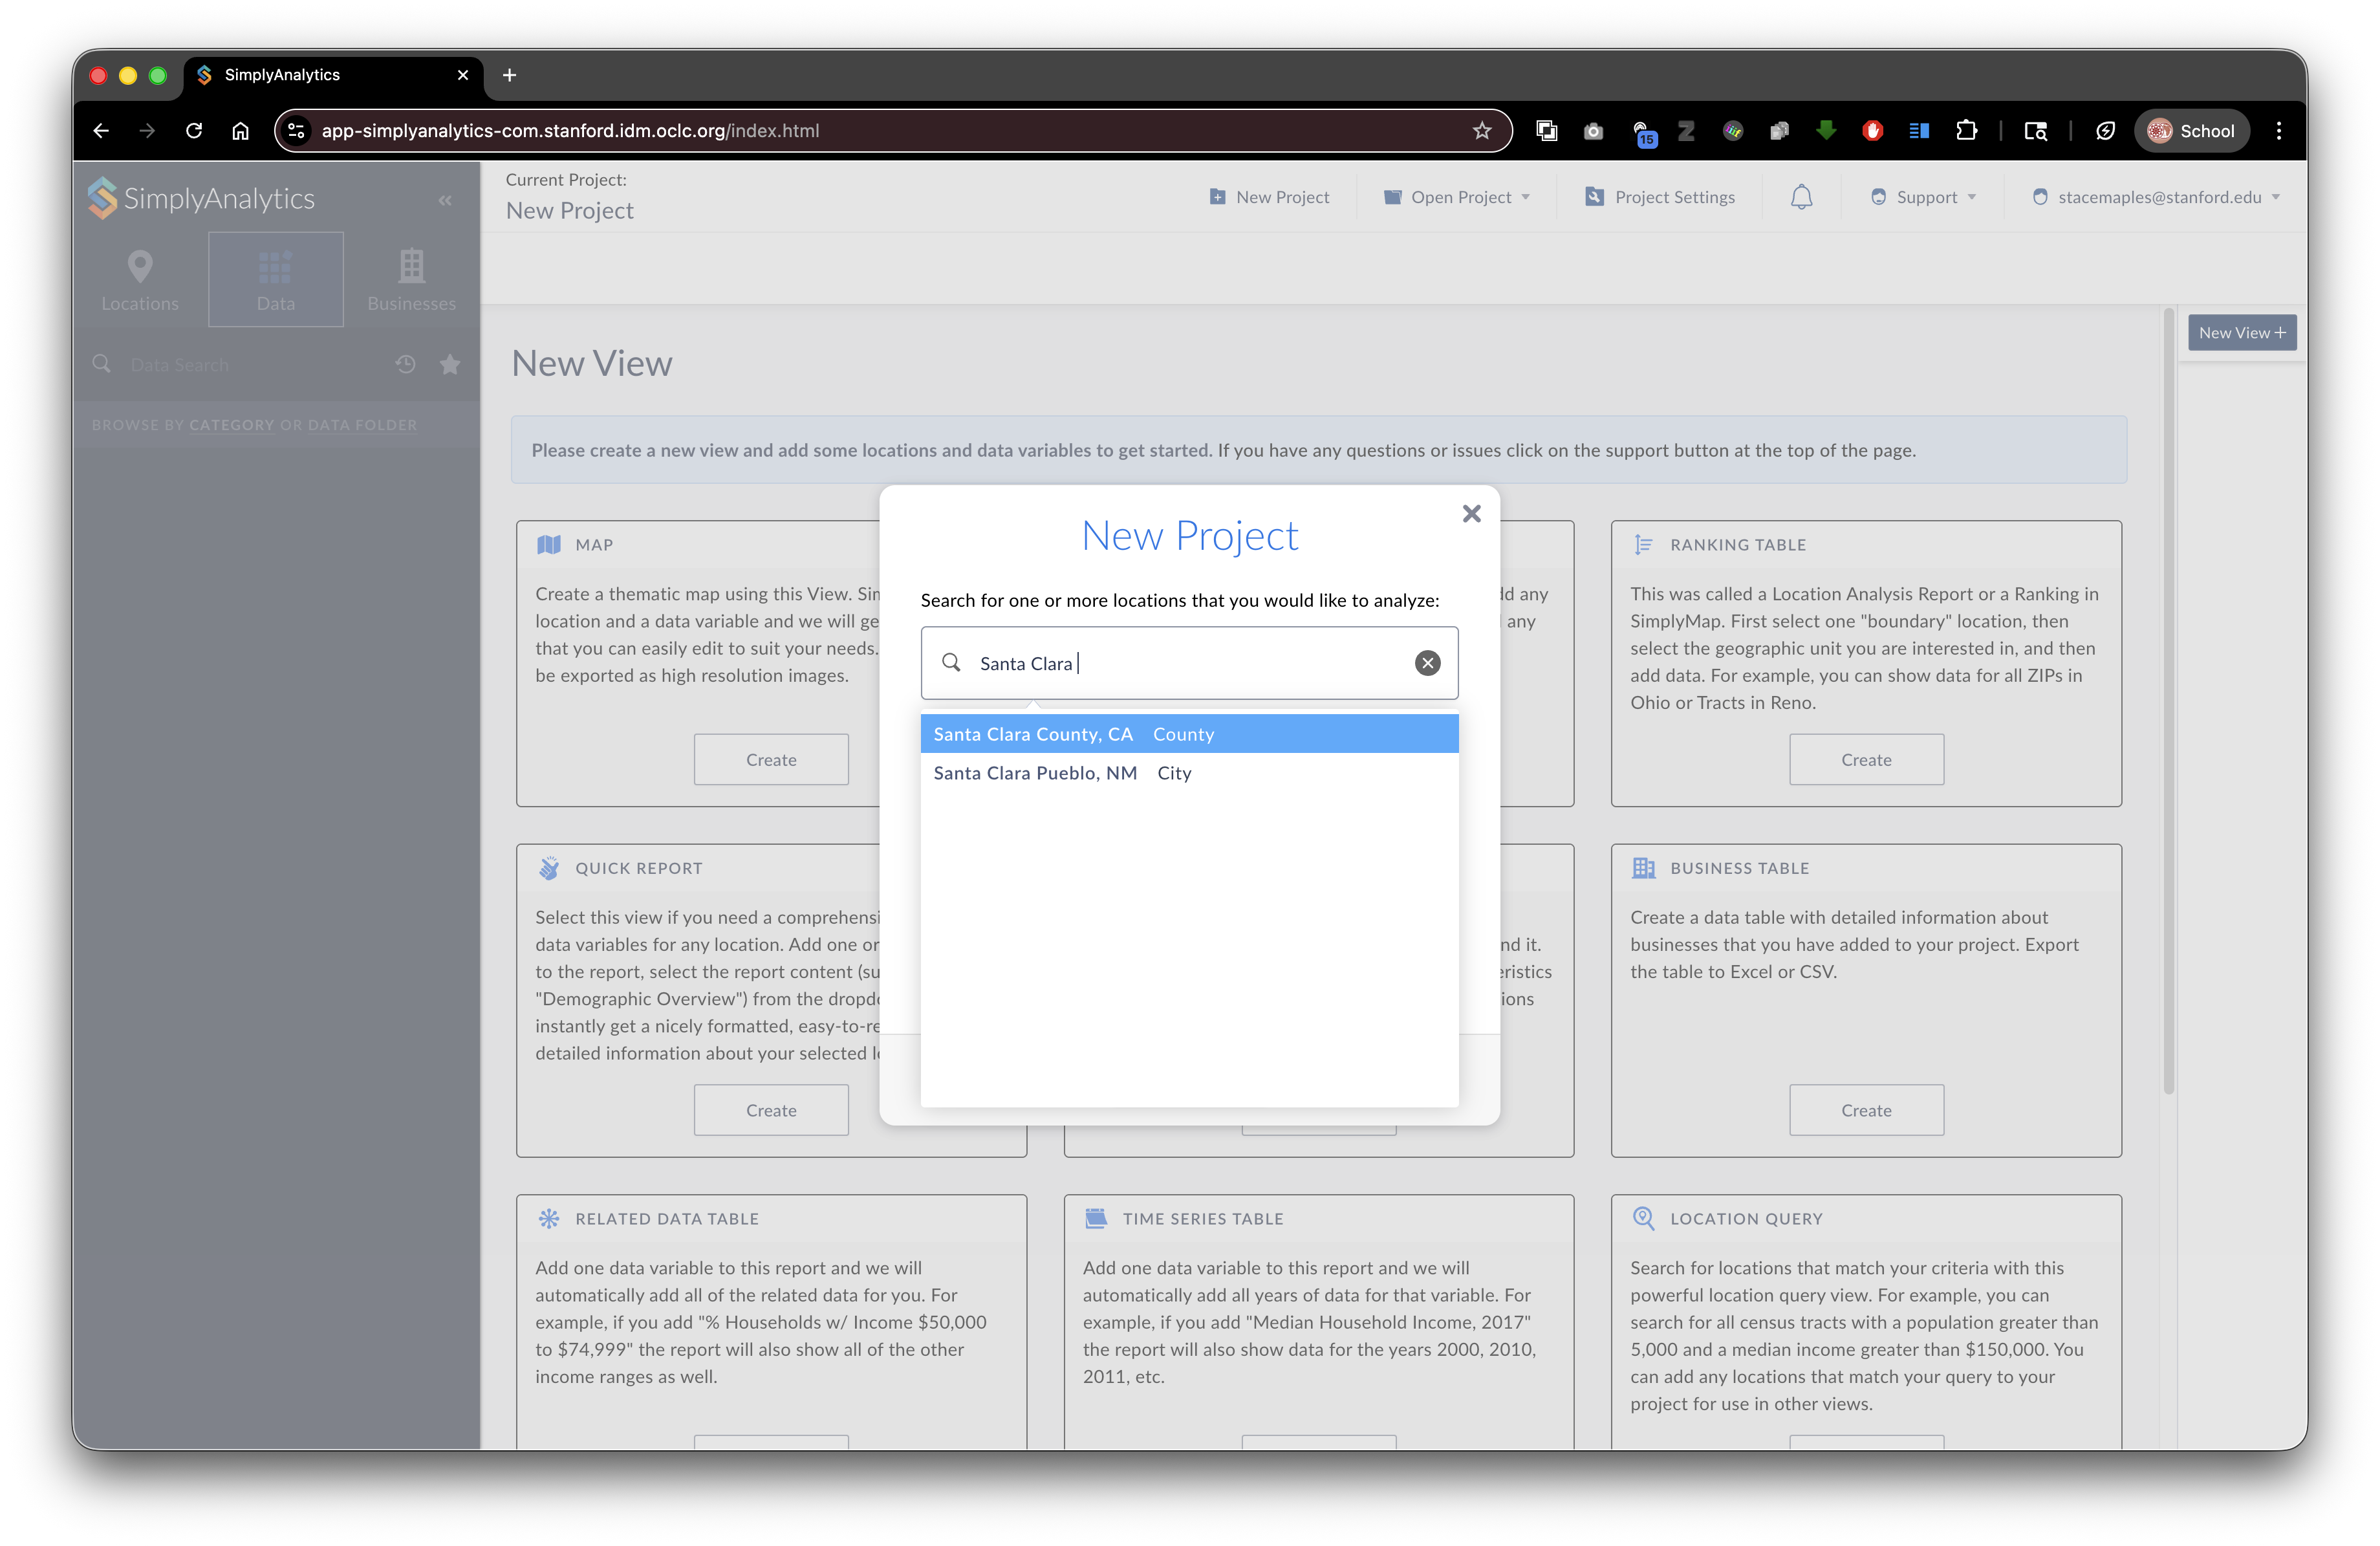
- A New Project dialog will appear asking you to search for one or more locations.
3) Select your location (example: Santa Clara County, CA)
- In the location search box, start typing your target area (e.g.,
Santa Clara). - Select the correct result from the list (example shown: Santa Clara County, CA).
4) (Optional) Choose “seed” variables, then create the project
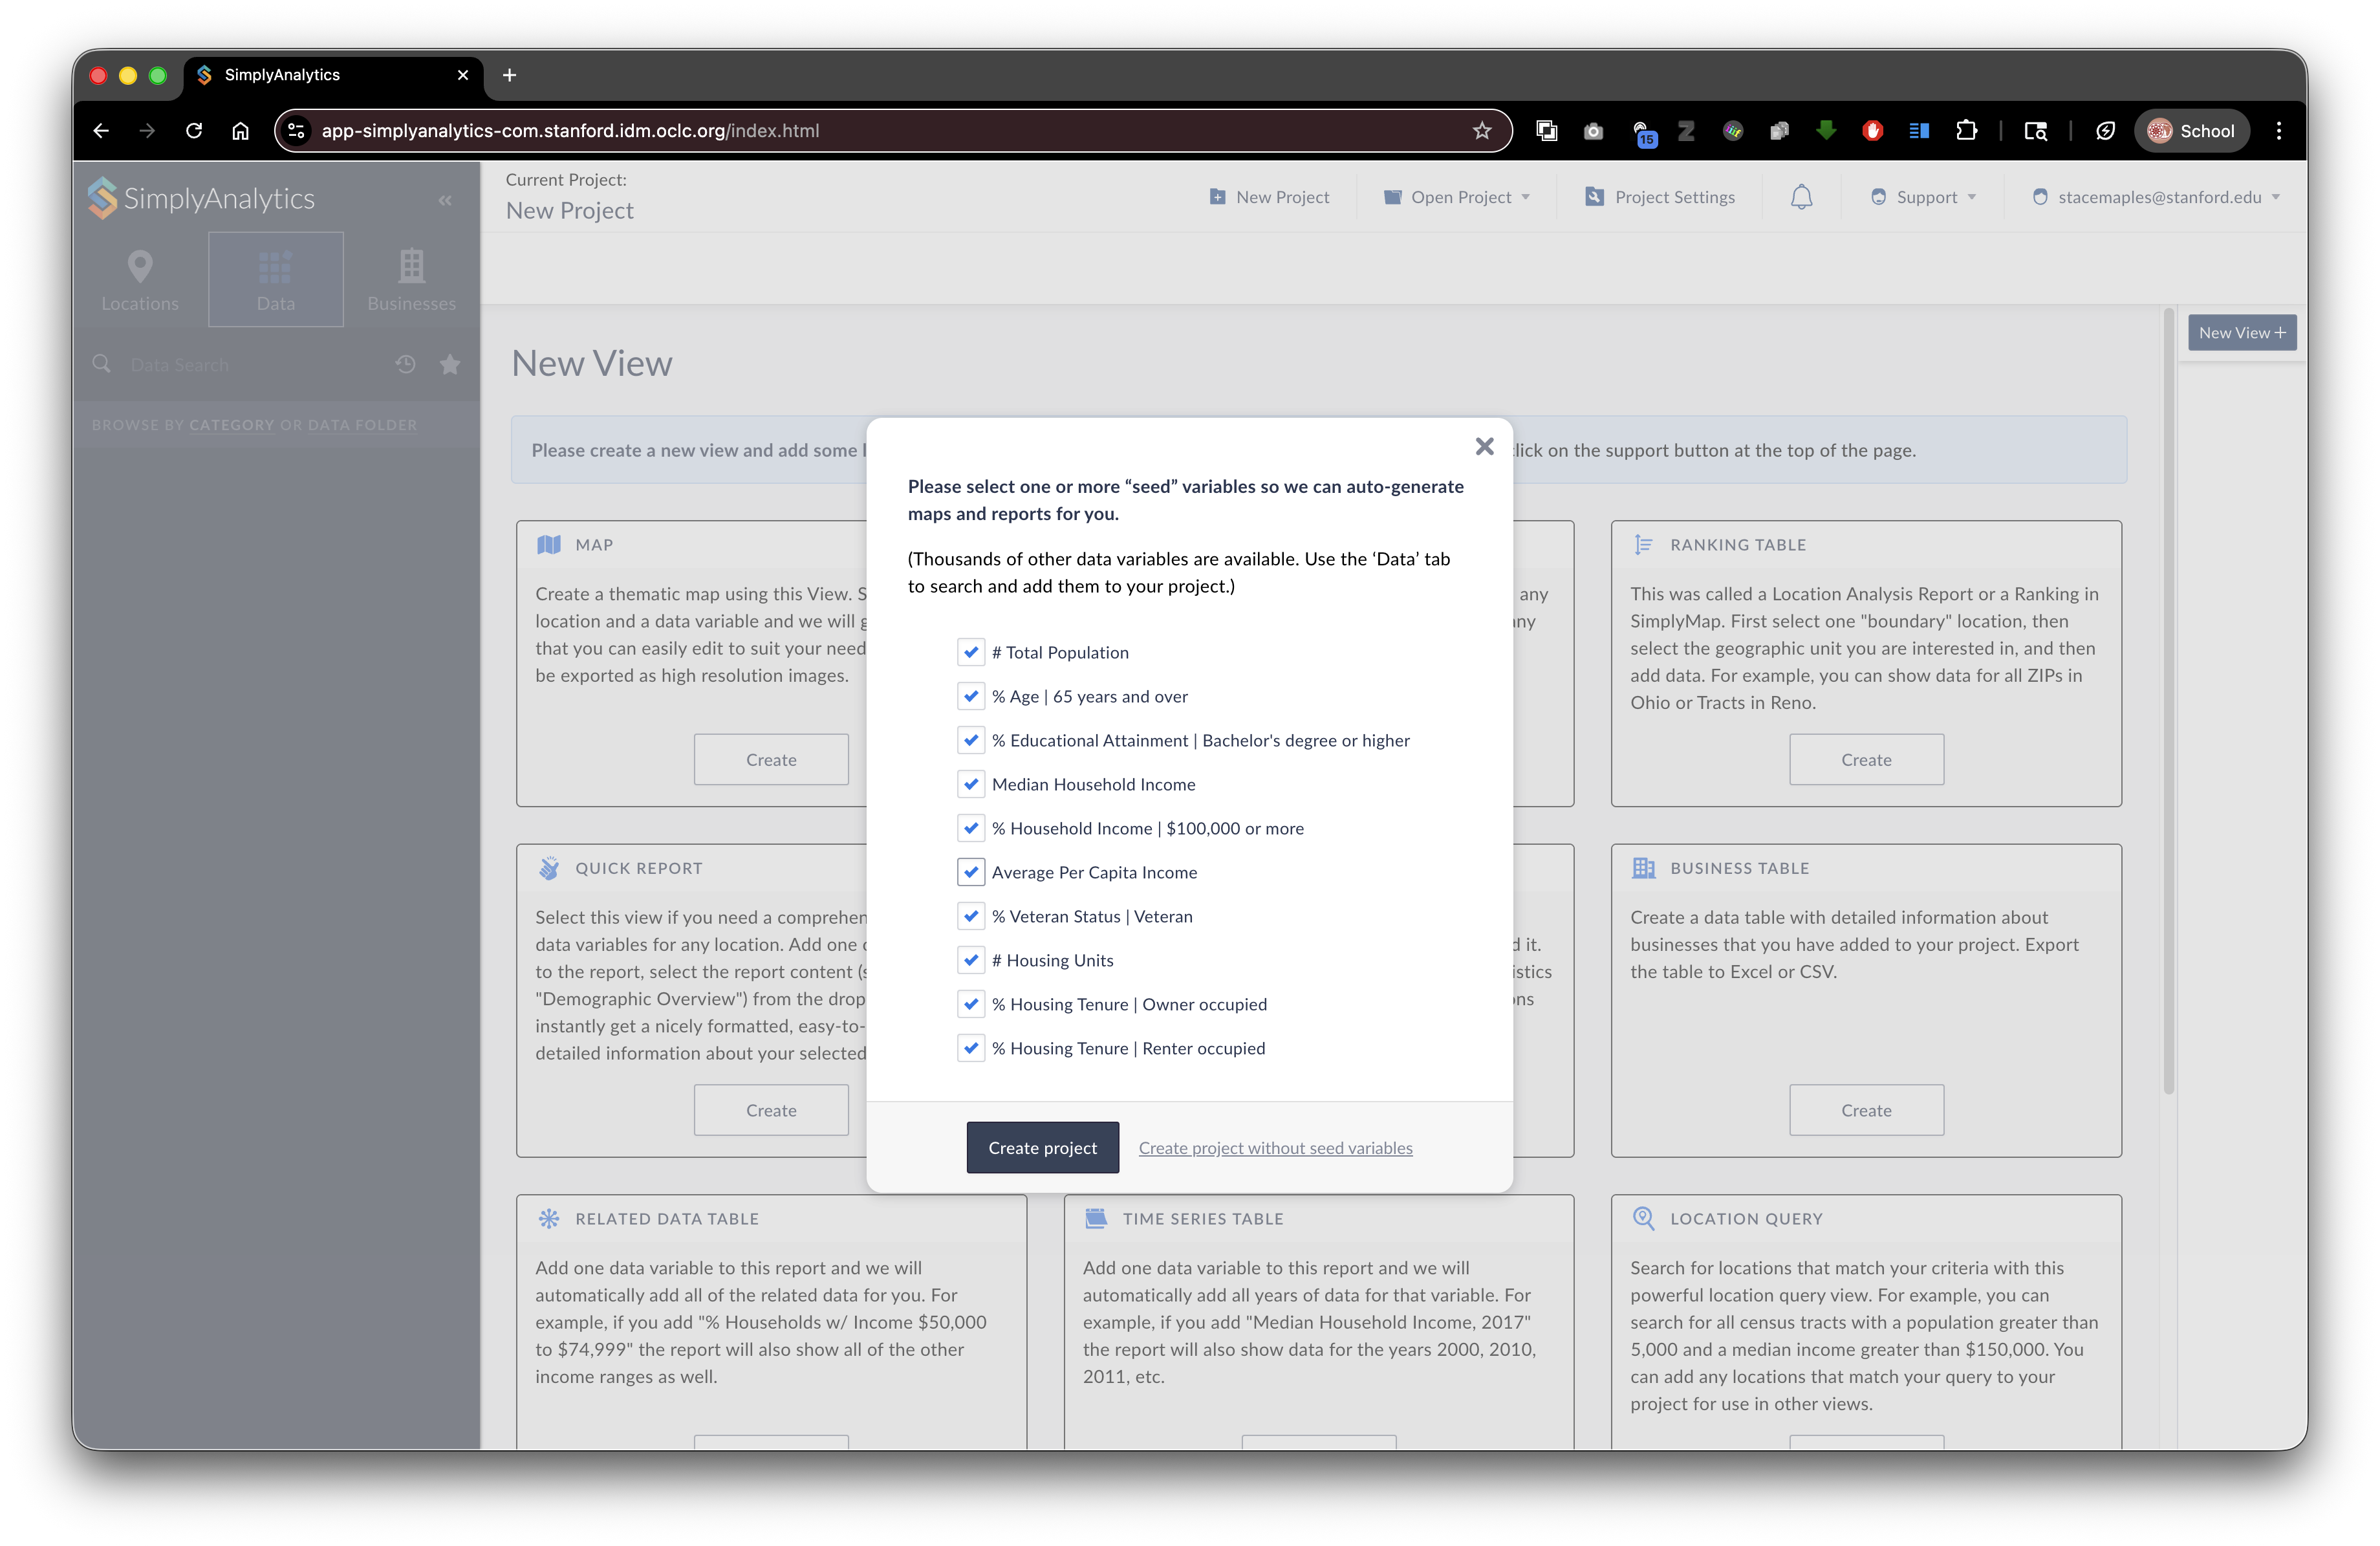
- After selecting a location, SimplyAnalytics may prompt you to pick “seed” variables (these help auto-generate initial maps/reports).
- Leave the defaults checked, or adjust as needed.
- Click Create project.
5) Confirm the map view and pick a geographic unit
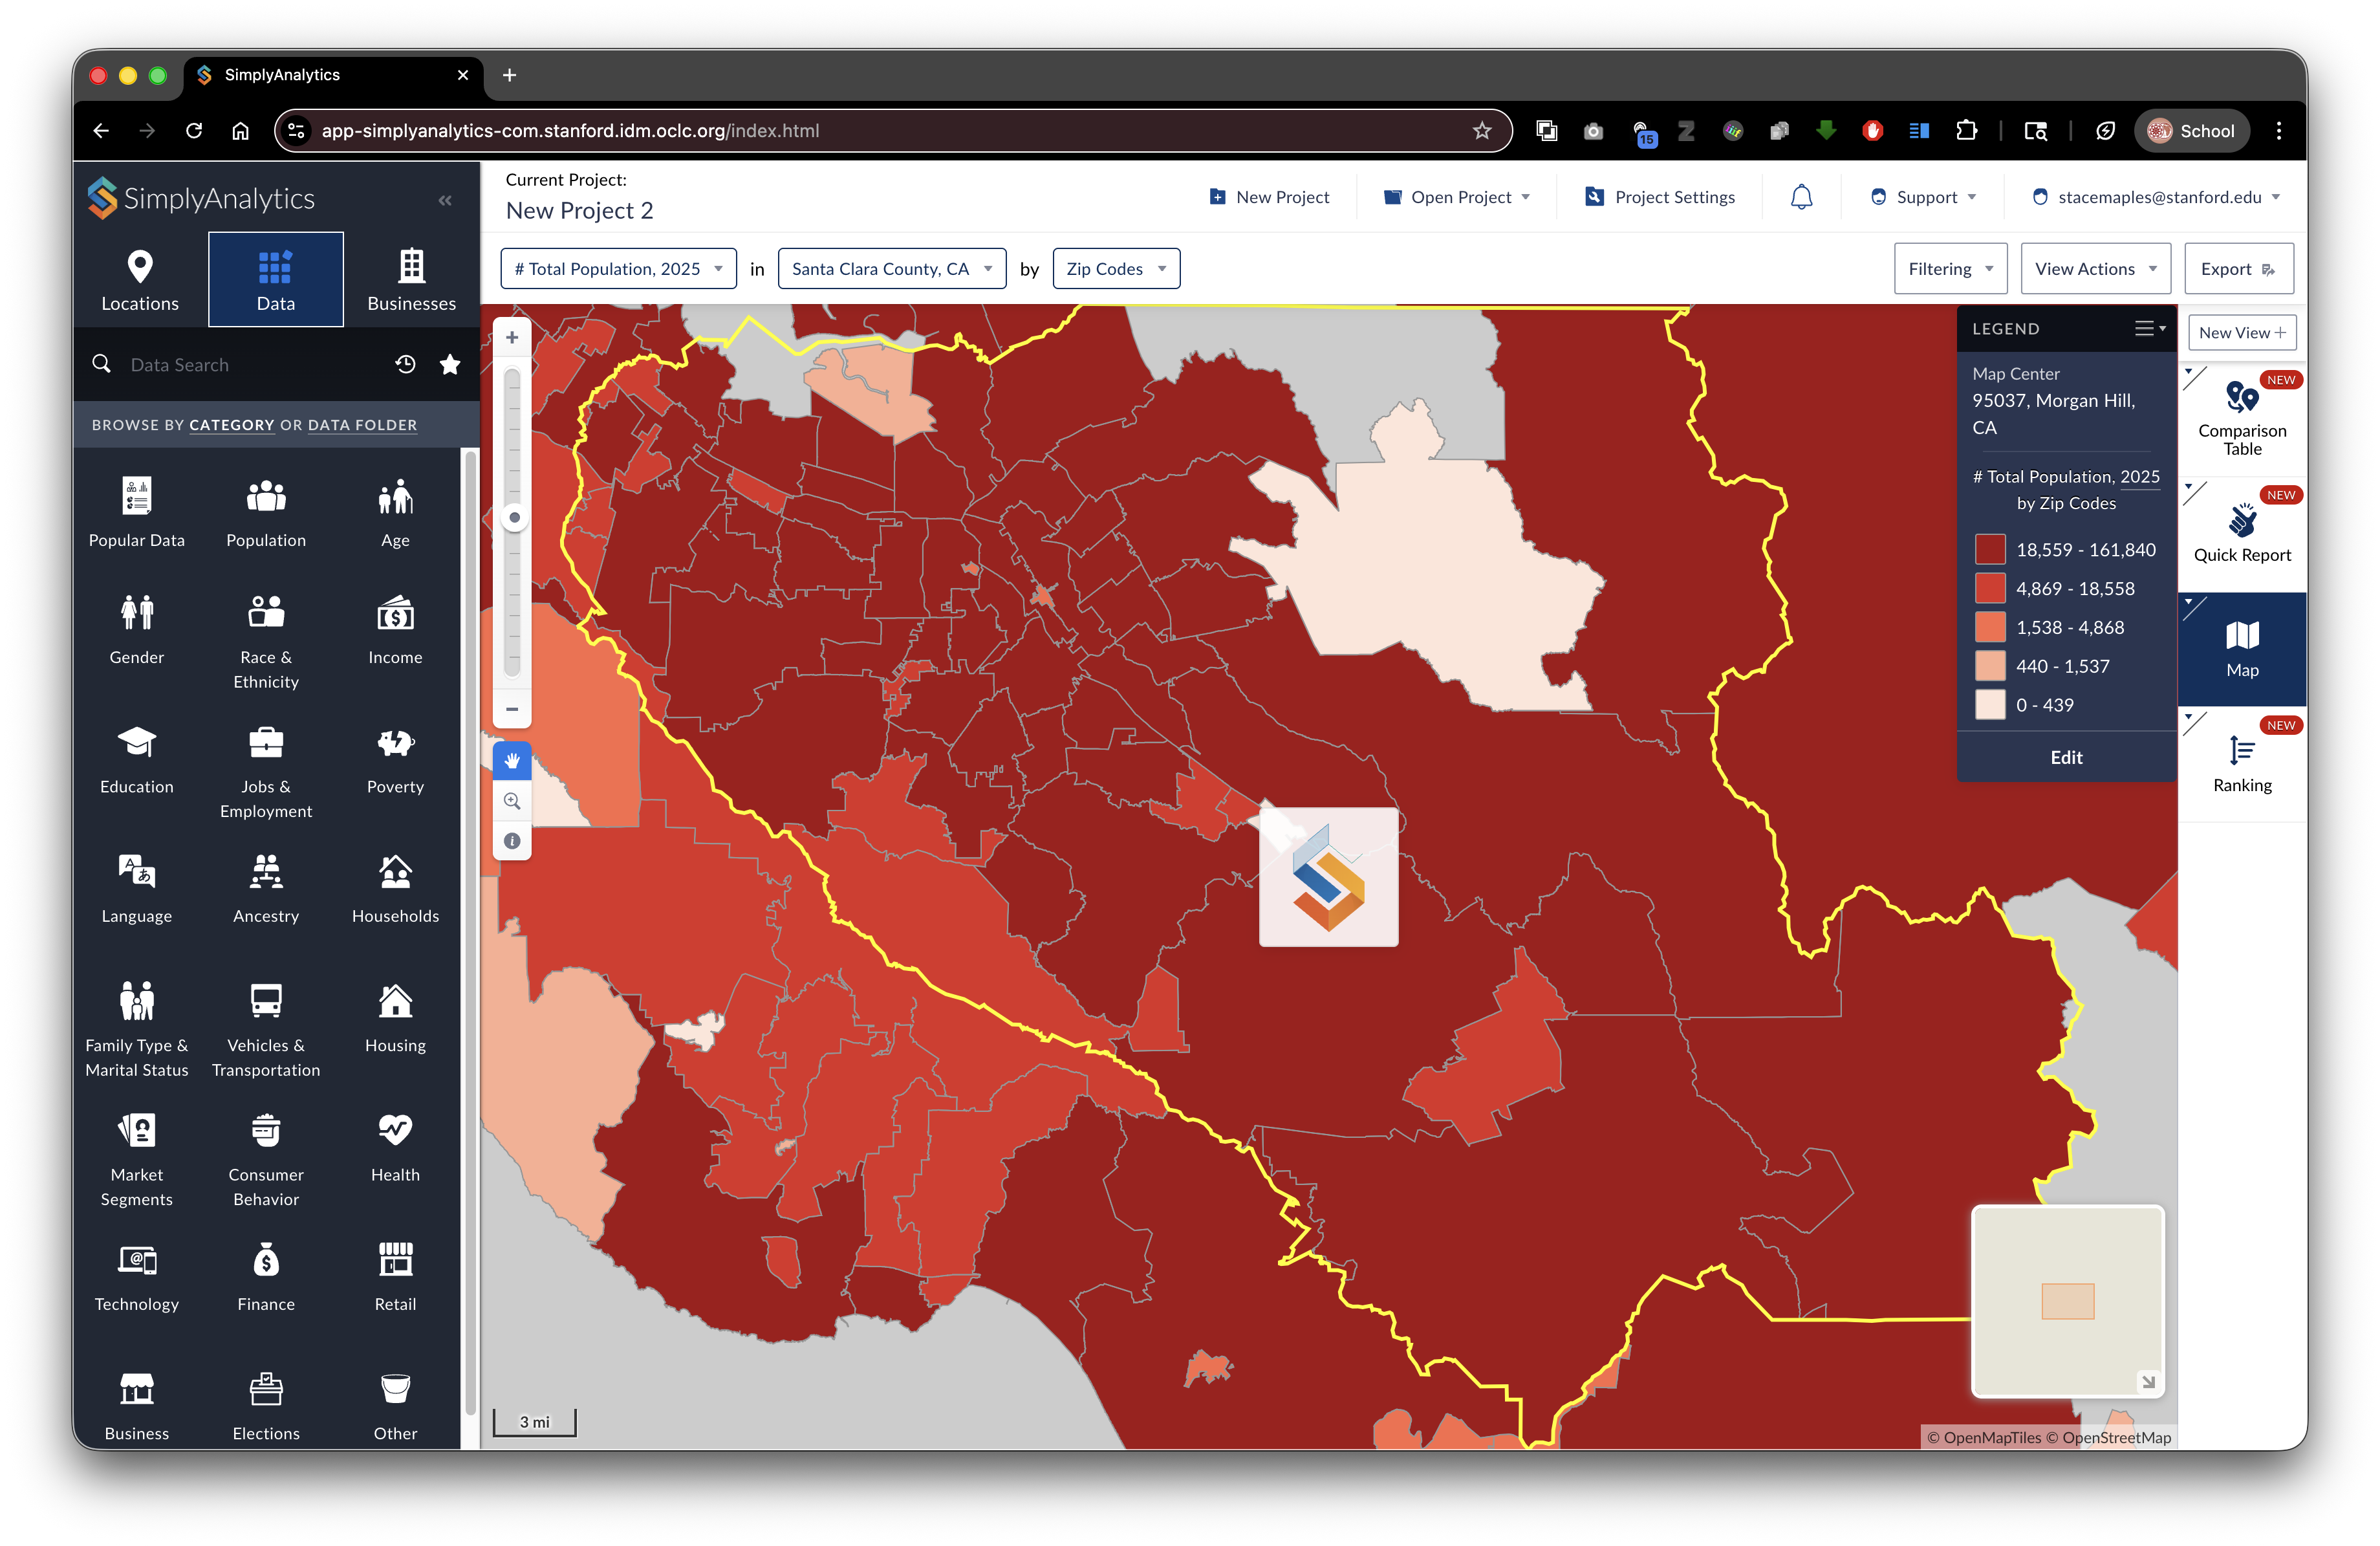
Once the project loads, you’ll see a thematic map.
Use the geography dropdown (top bar) to choose the output geography you want.
- Example shown switching from Zip Codes to Census Tracts.
6) Choose the data variable you want mapped (example: income)
You can change the mapped variable in two common ways:
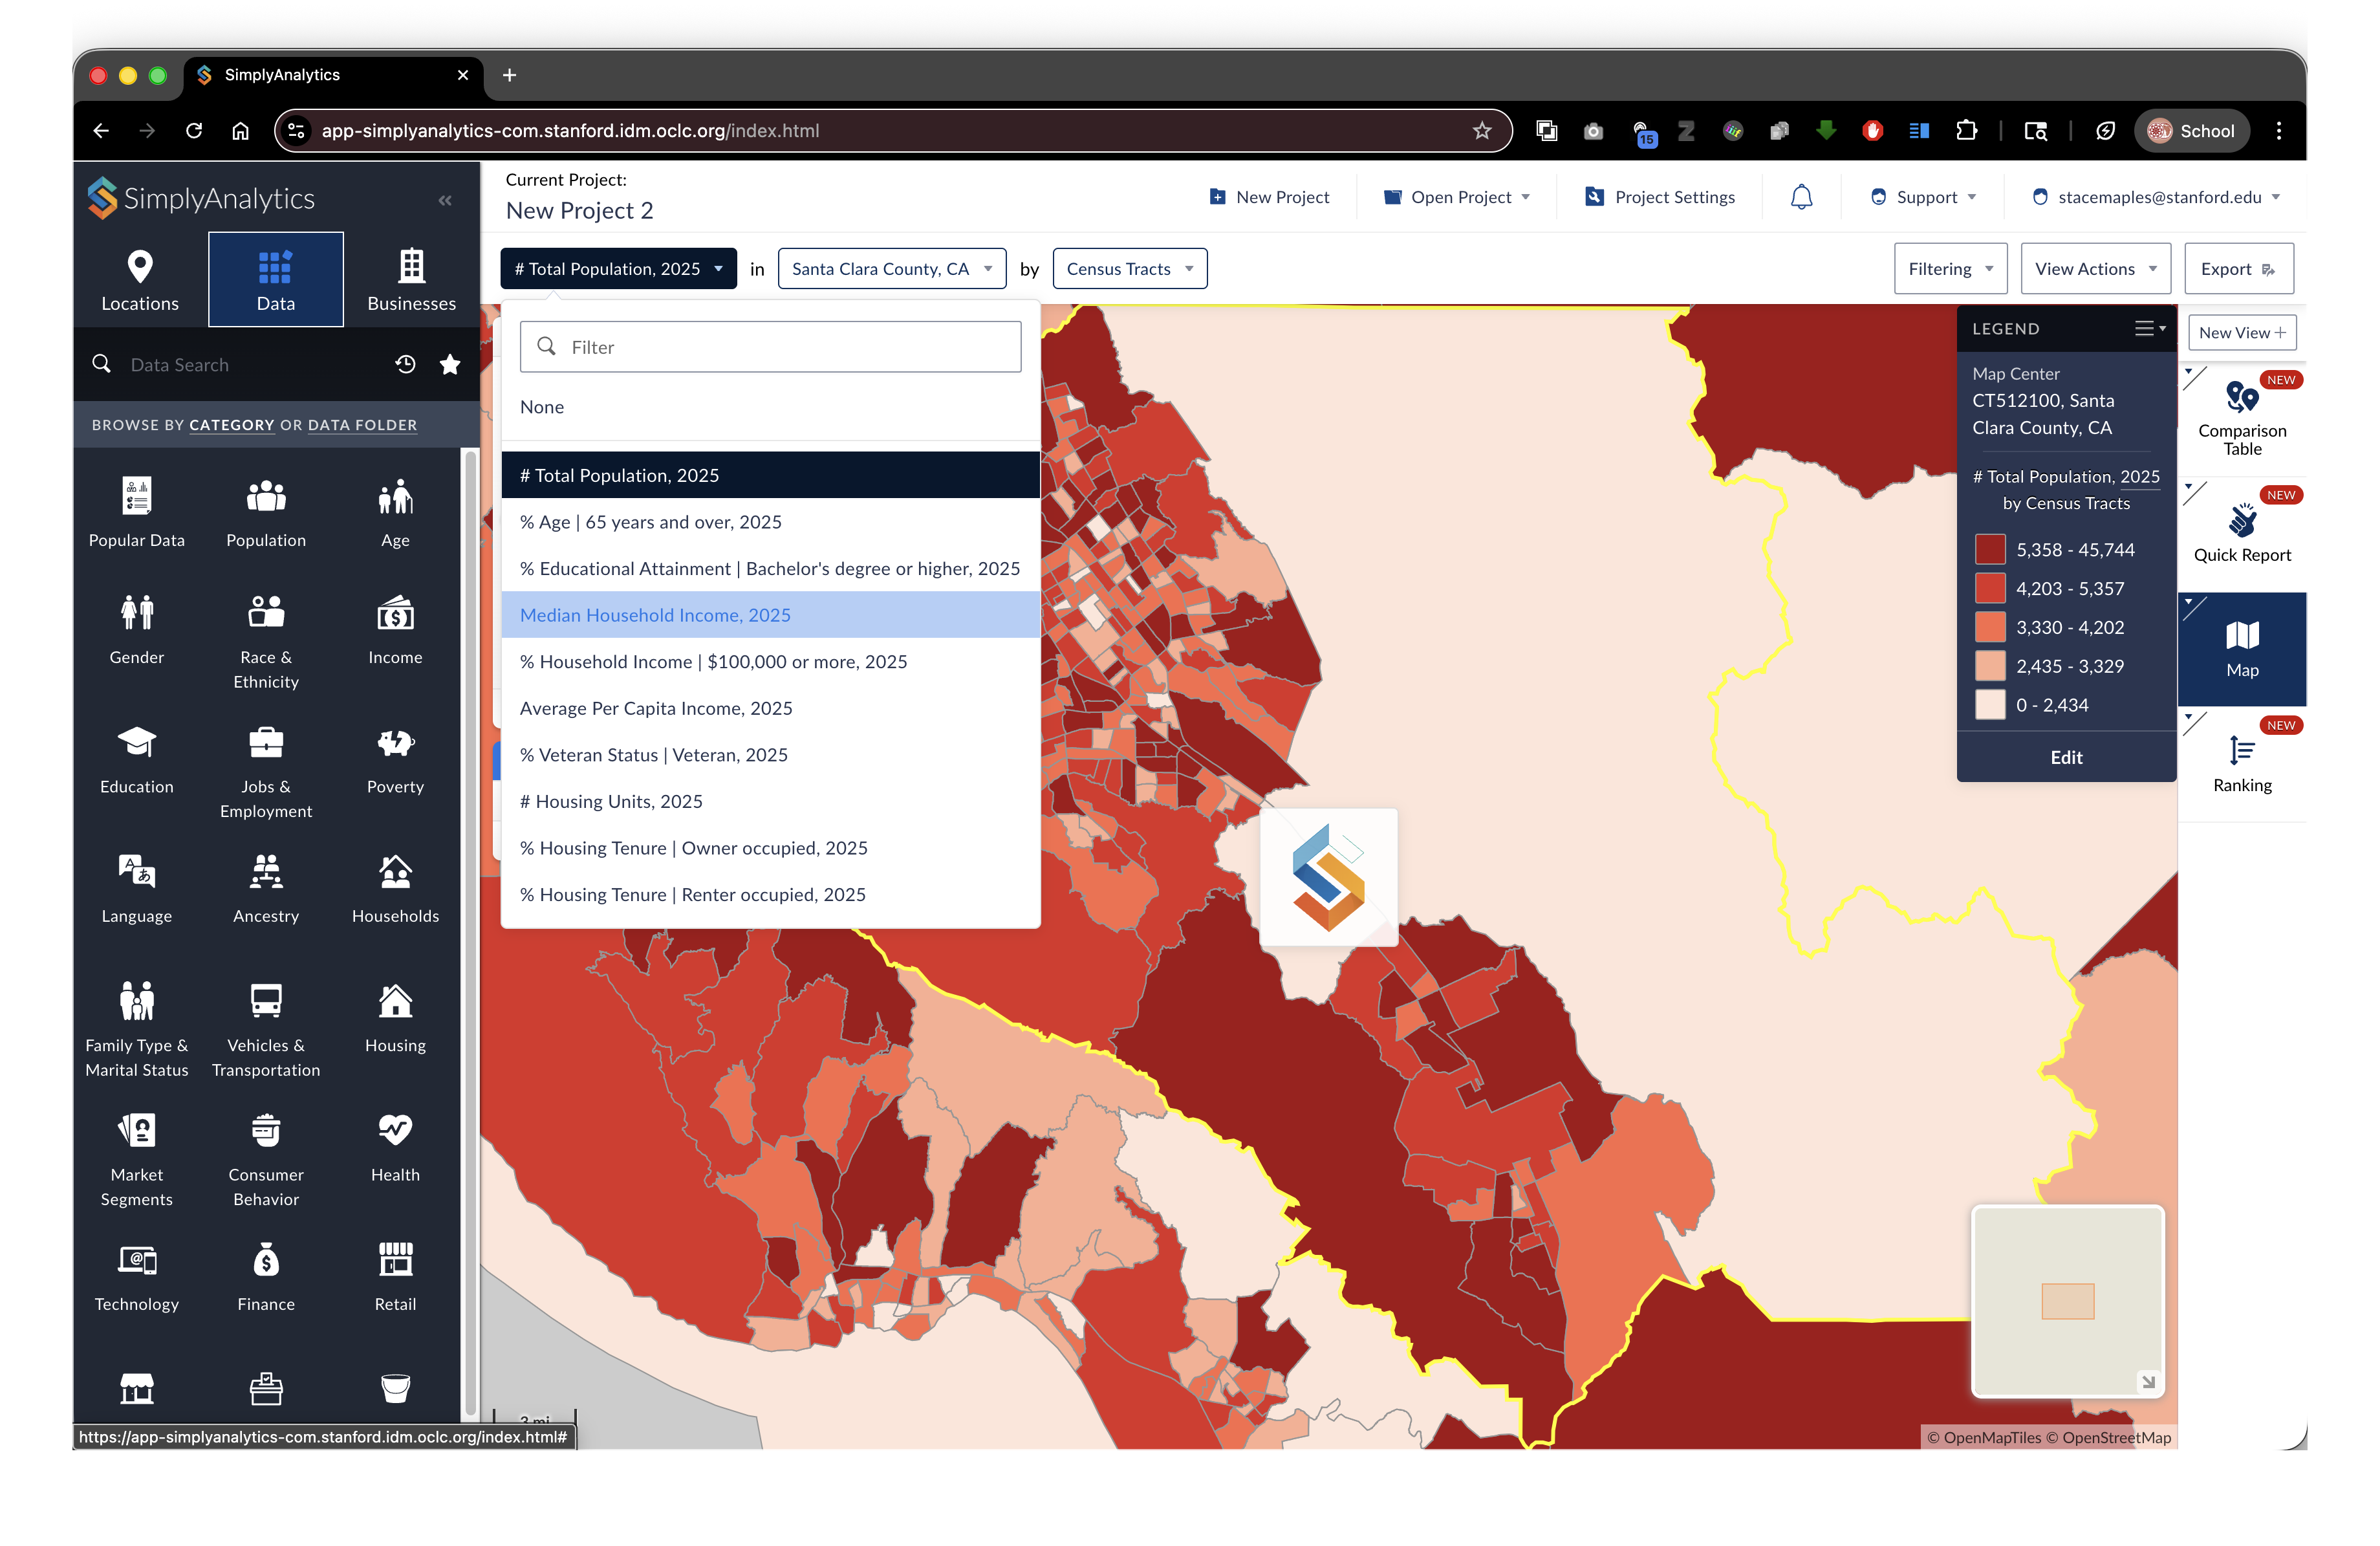
Option A: Quick variable dropdown
- Click the variable dropdown in the top bar.
- Select a variable (example shown: Median Household Income, 2025).
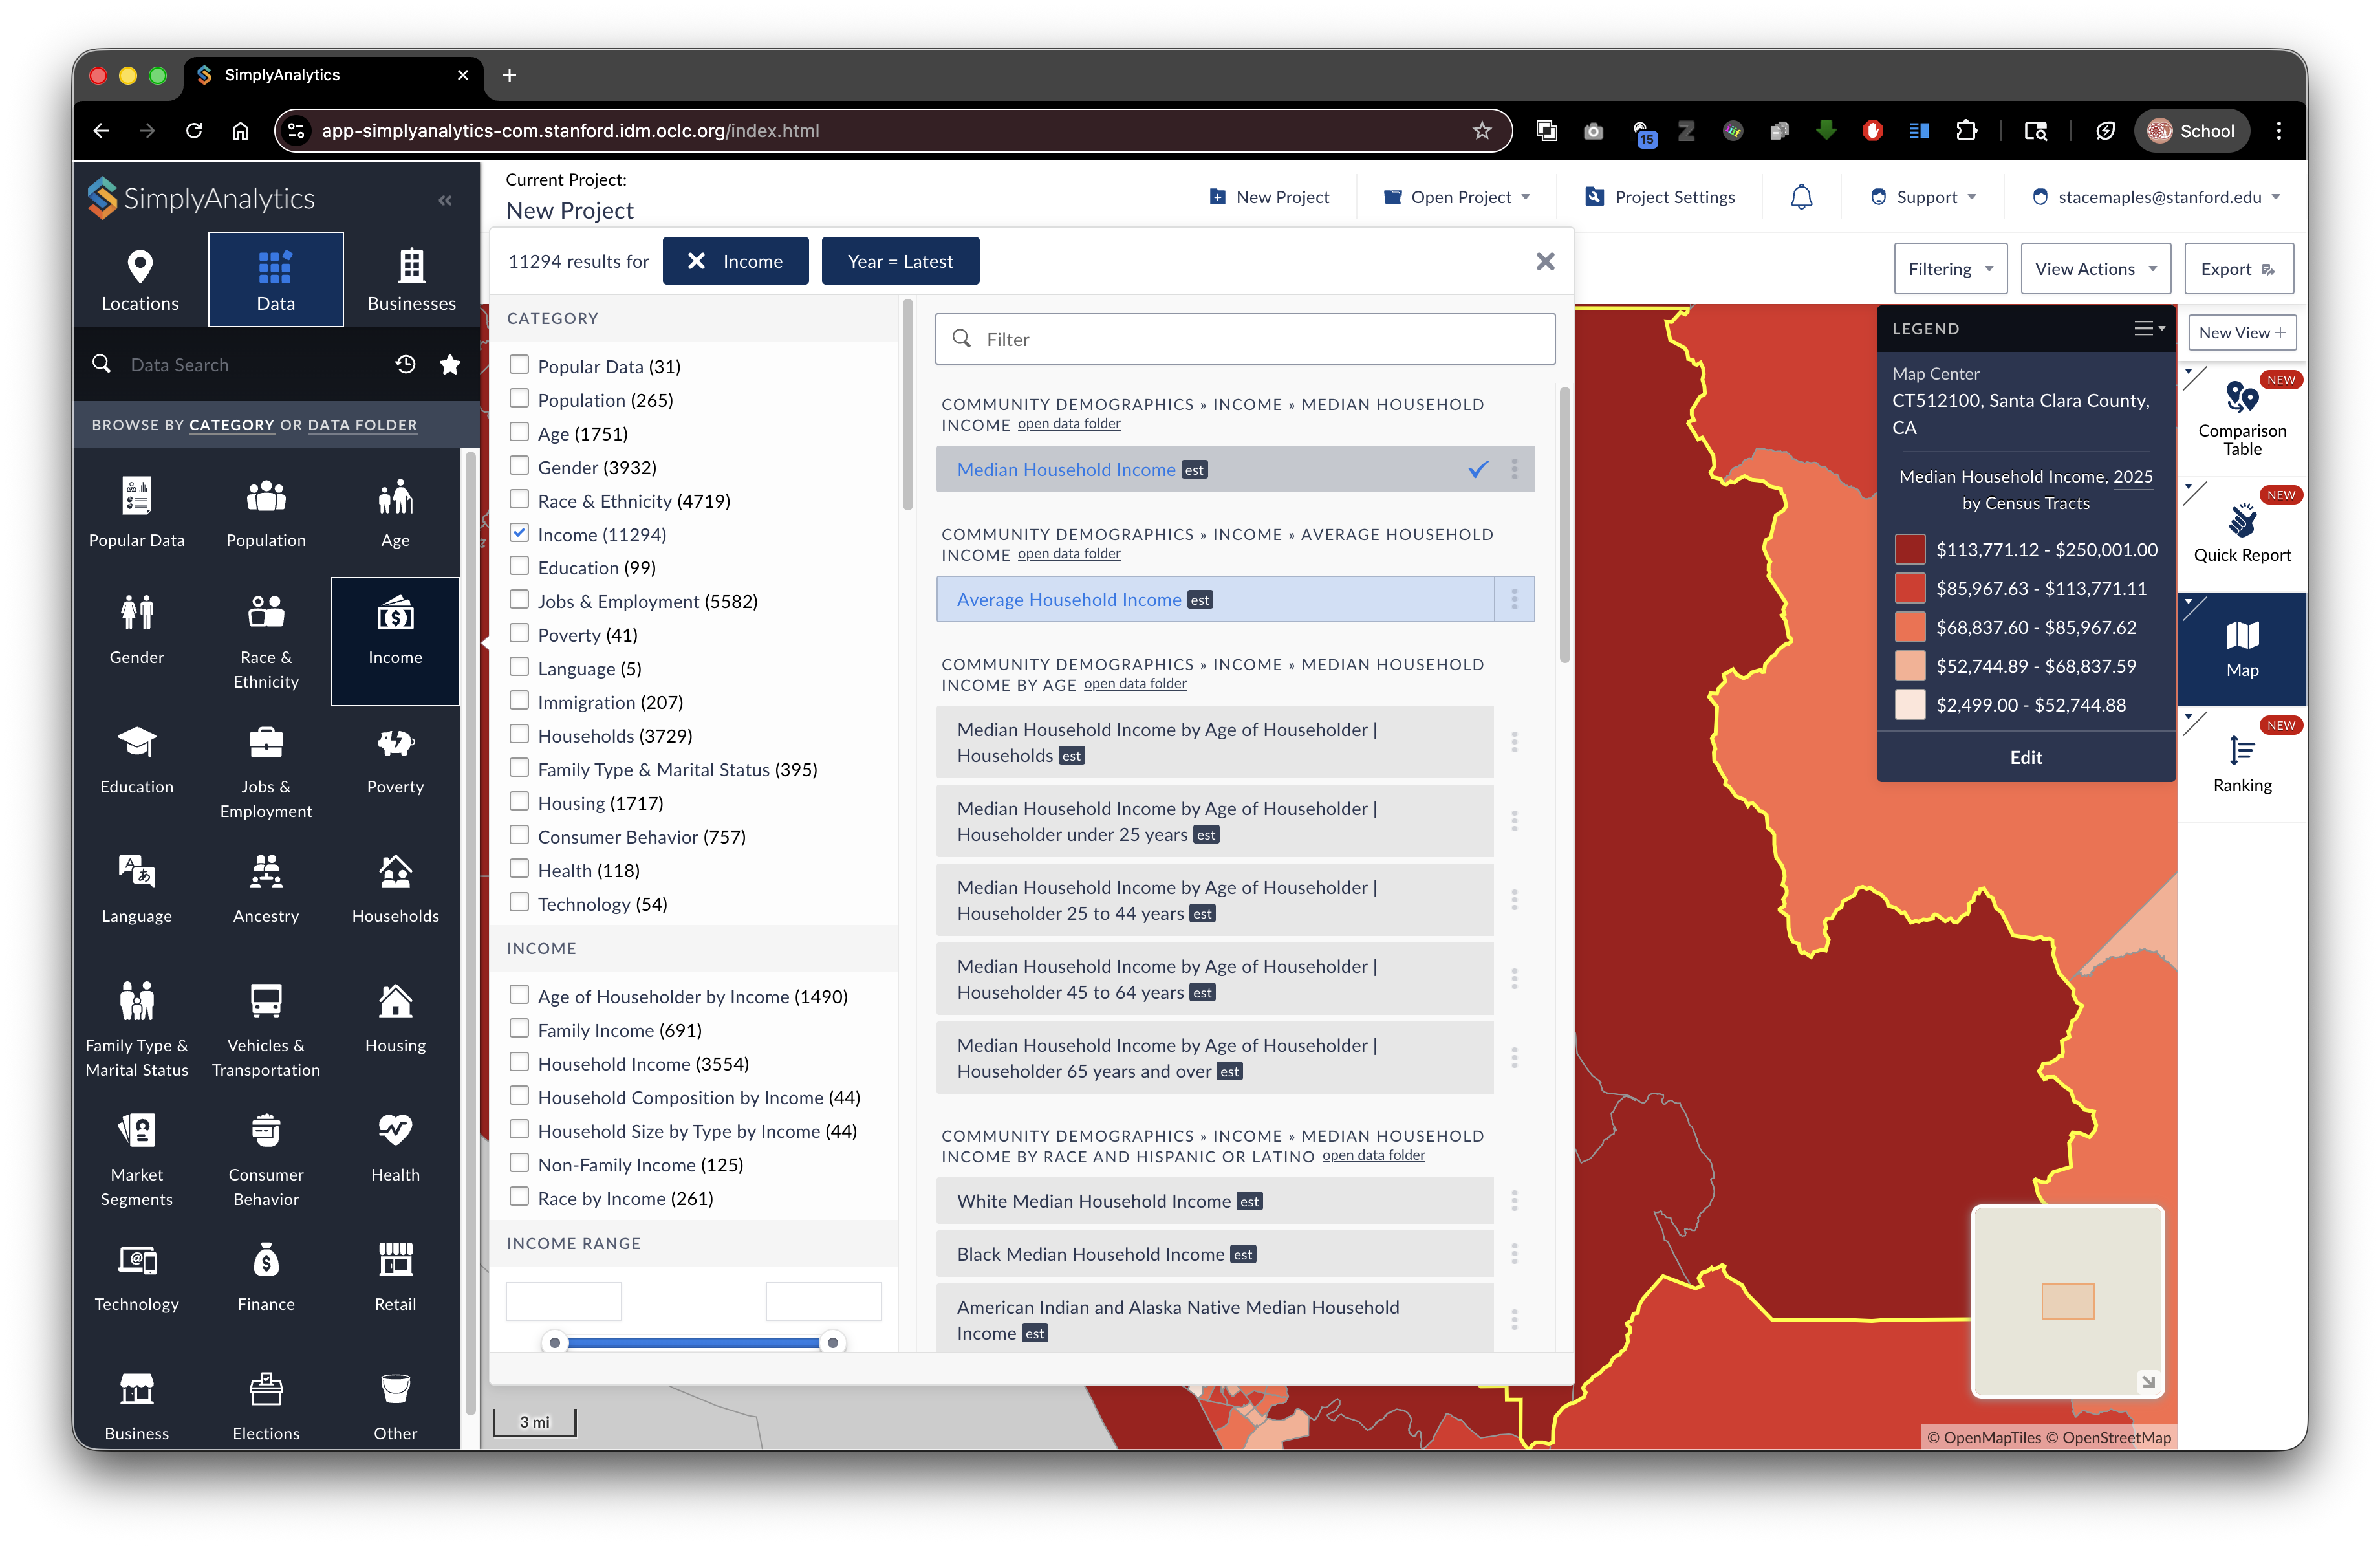
Option B: Use the Data panel for deeper searching
- Click Data (left sidebar).
- Filter/browse categories (example: Income).
- Select the variable you want (example shown: Average Household Income).
7) (Optional) Adjust the map classification/legend before exporting
This won’t change the exported geometry, but it’s useful if you’re trying to match a cartographic look before export.
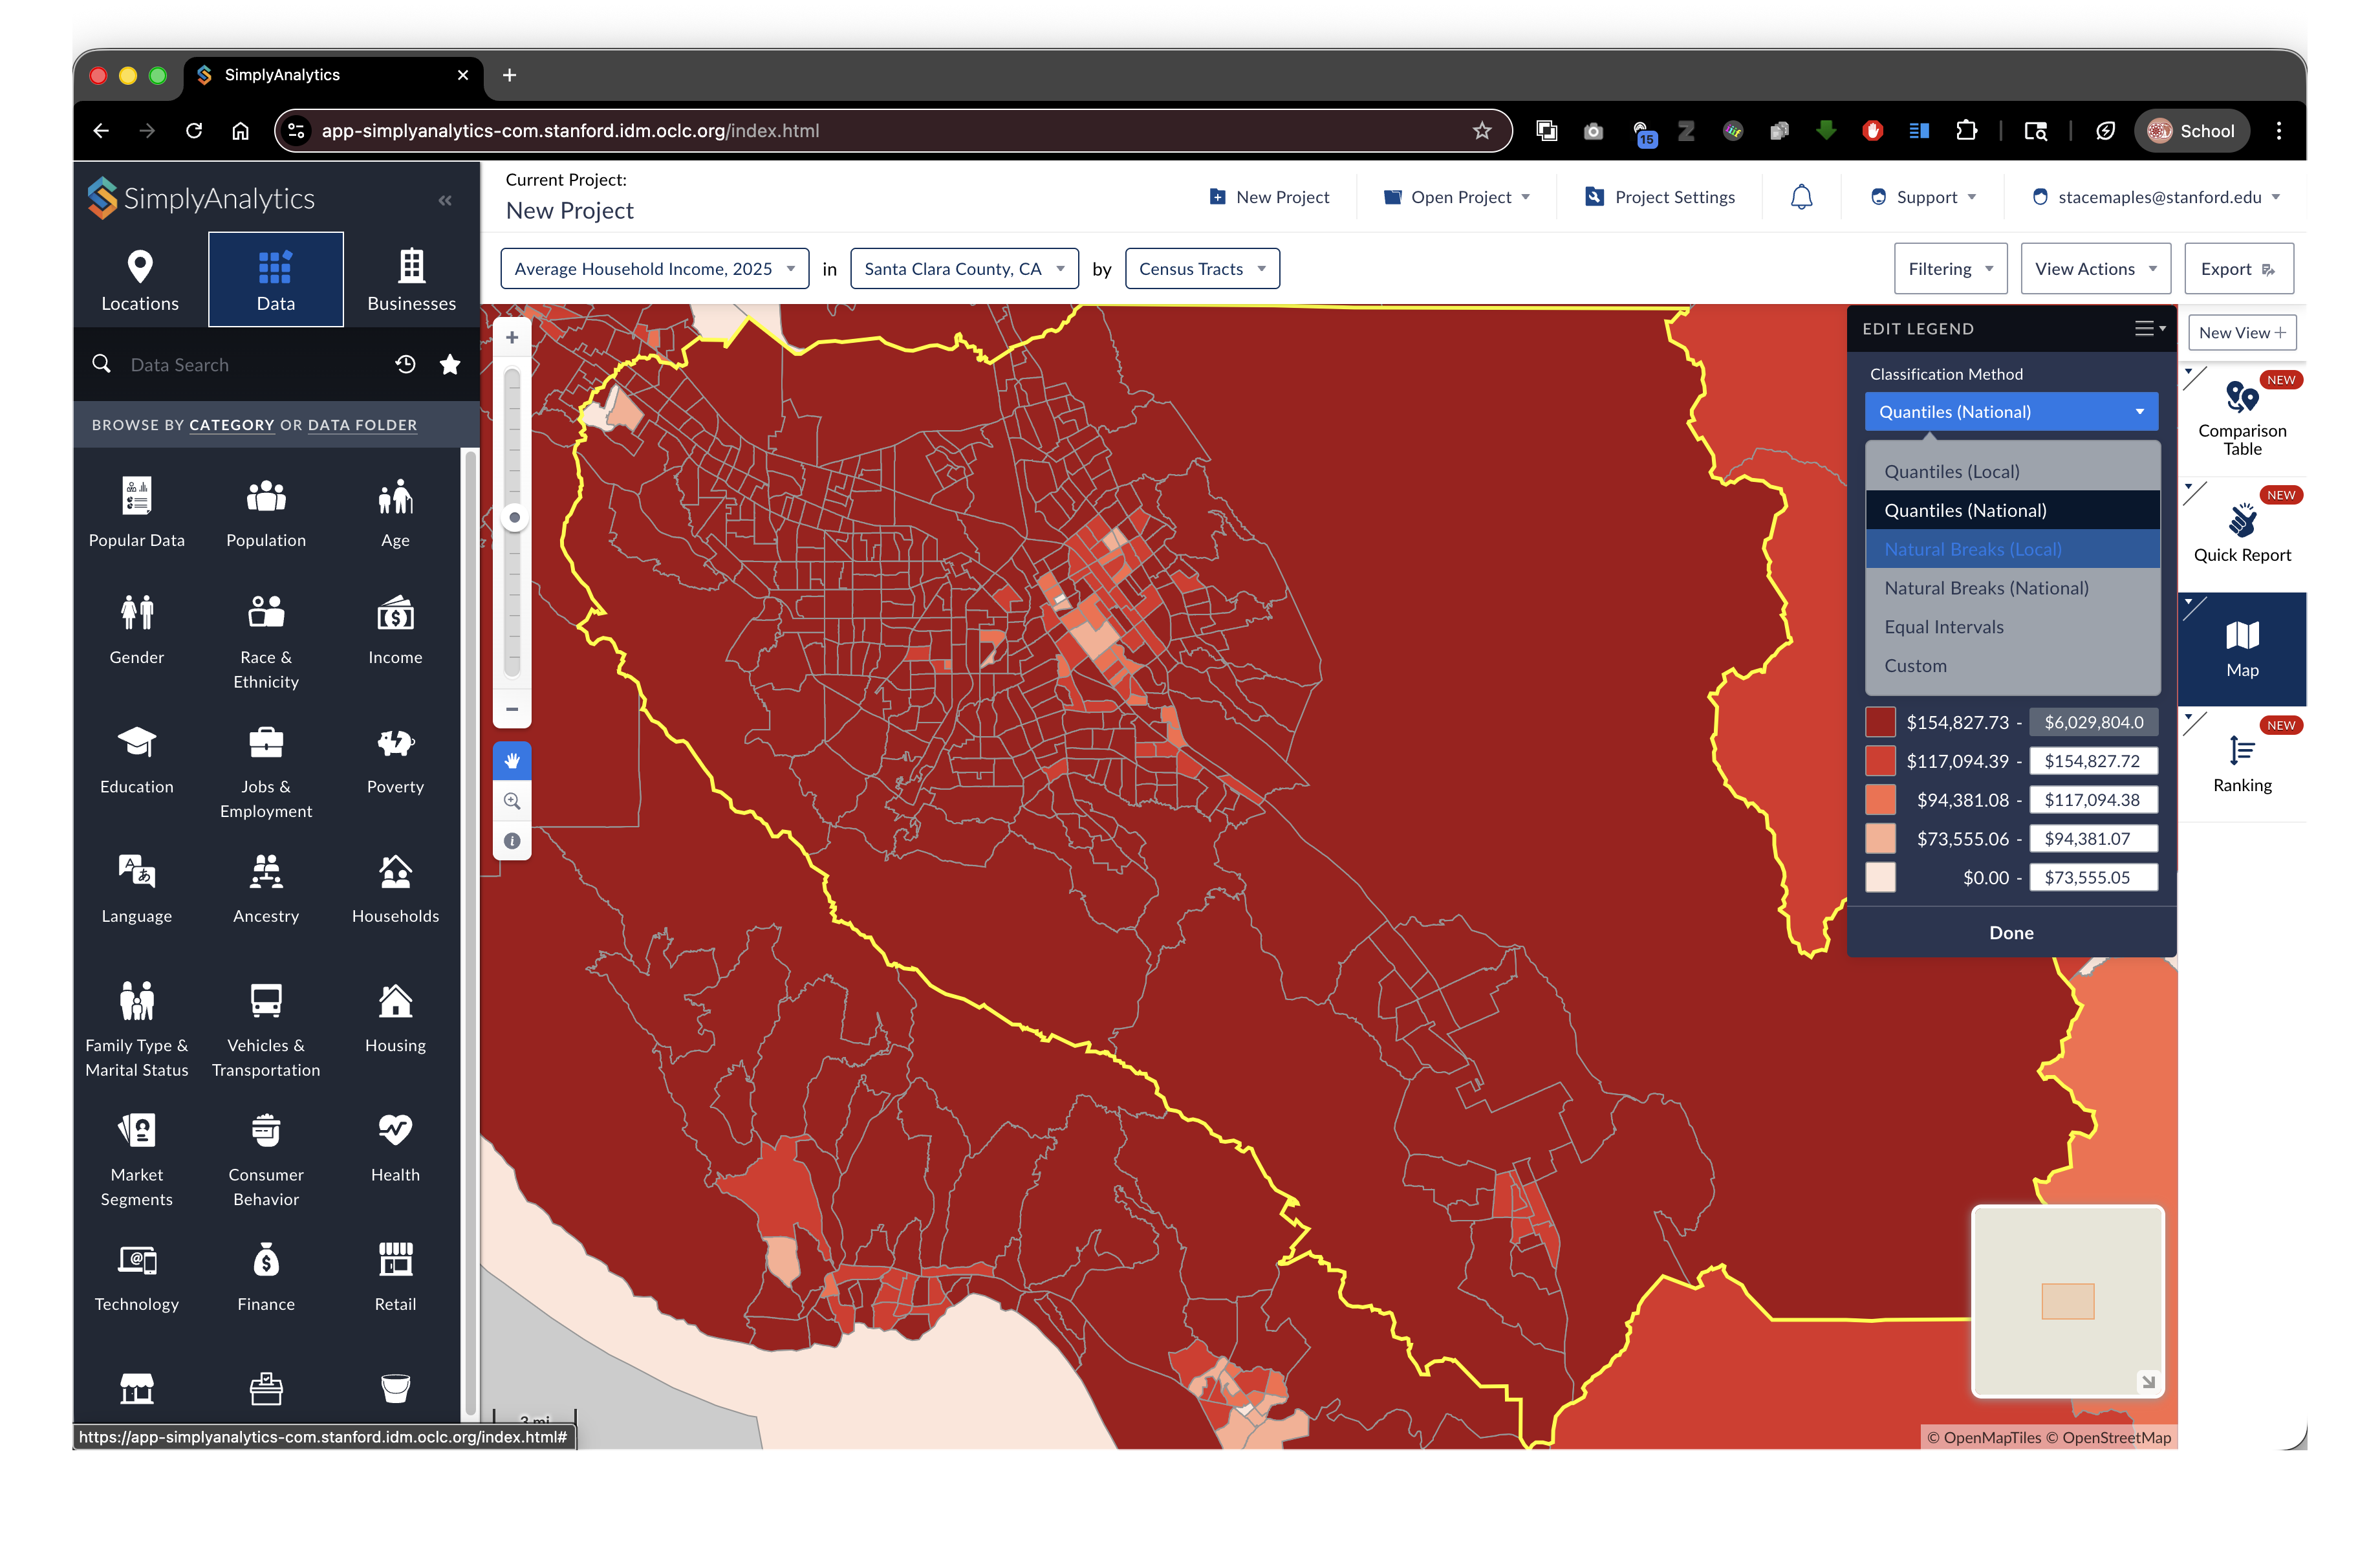
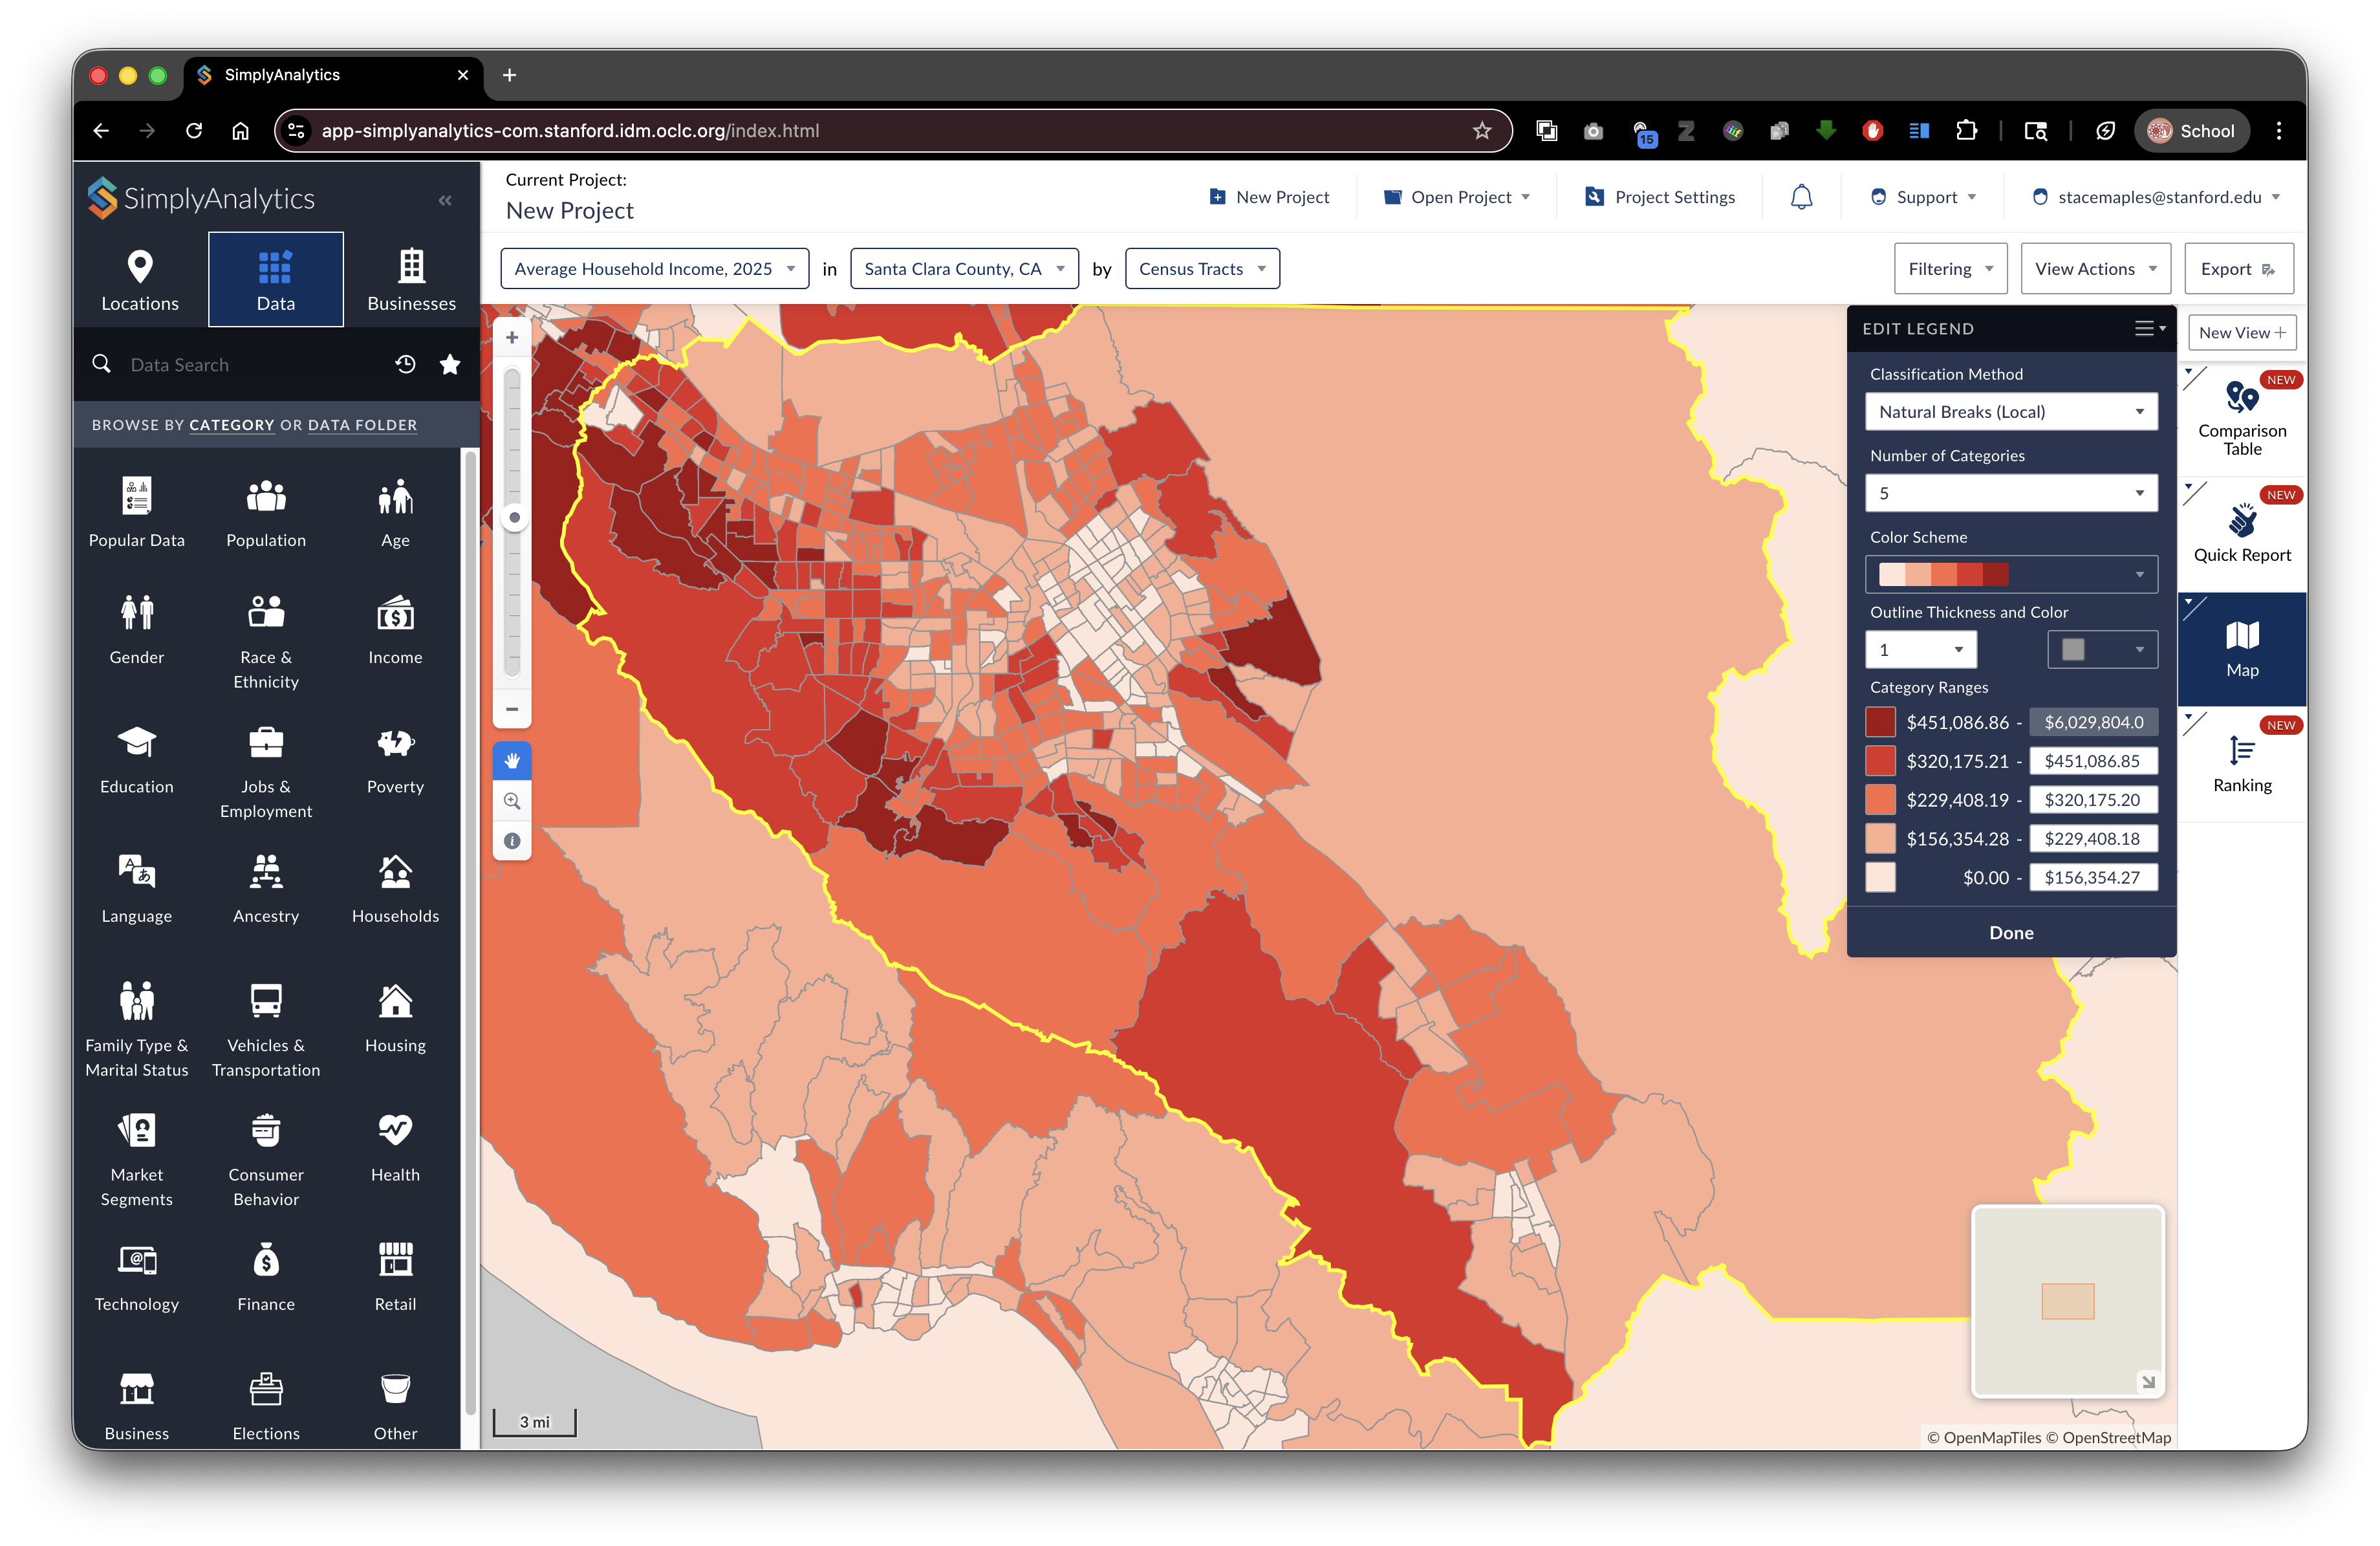
- In the legend panel, click Edit.
- Choose a Classification Method (example shown: switching to Natural Breaks (Local)).
- Click Done.
8) Export the shapefile
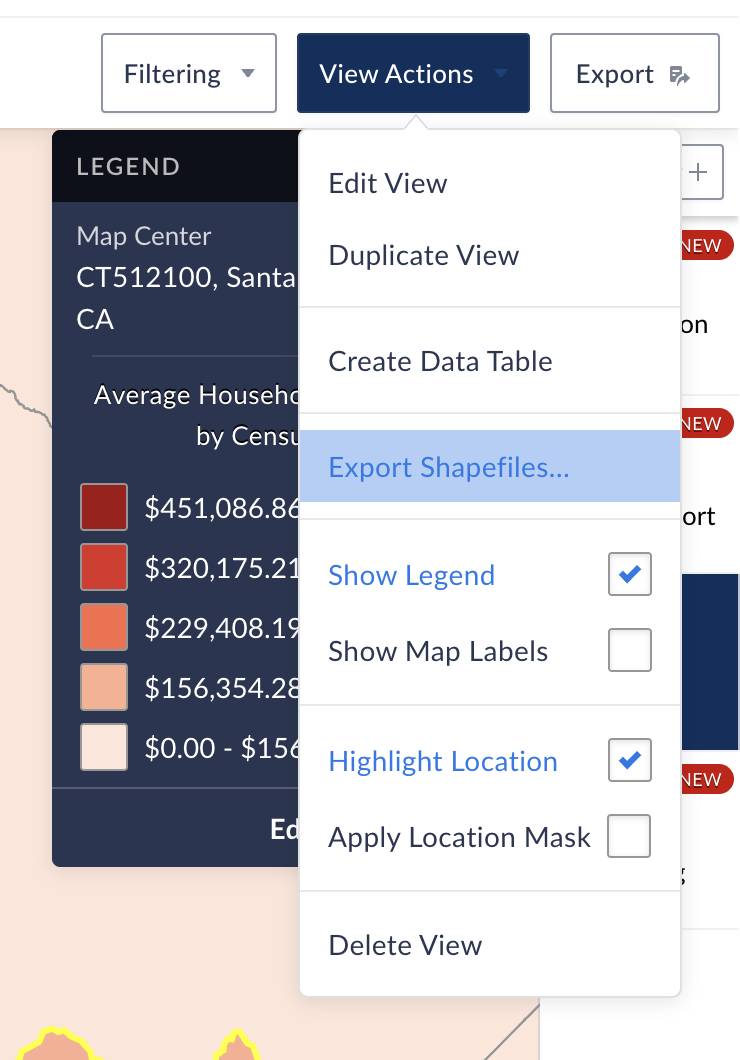
- In the top bar, open View Actions.
- Click Export Shapefiles…
9) Configure the export
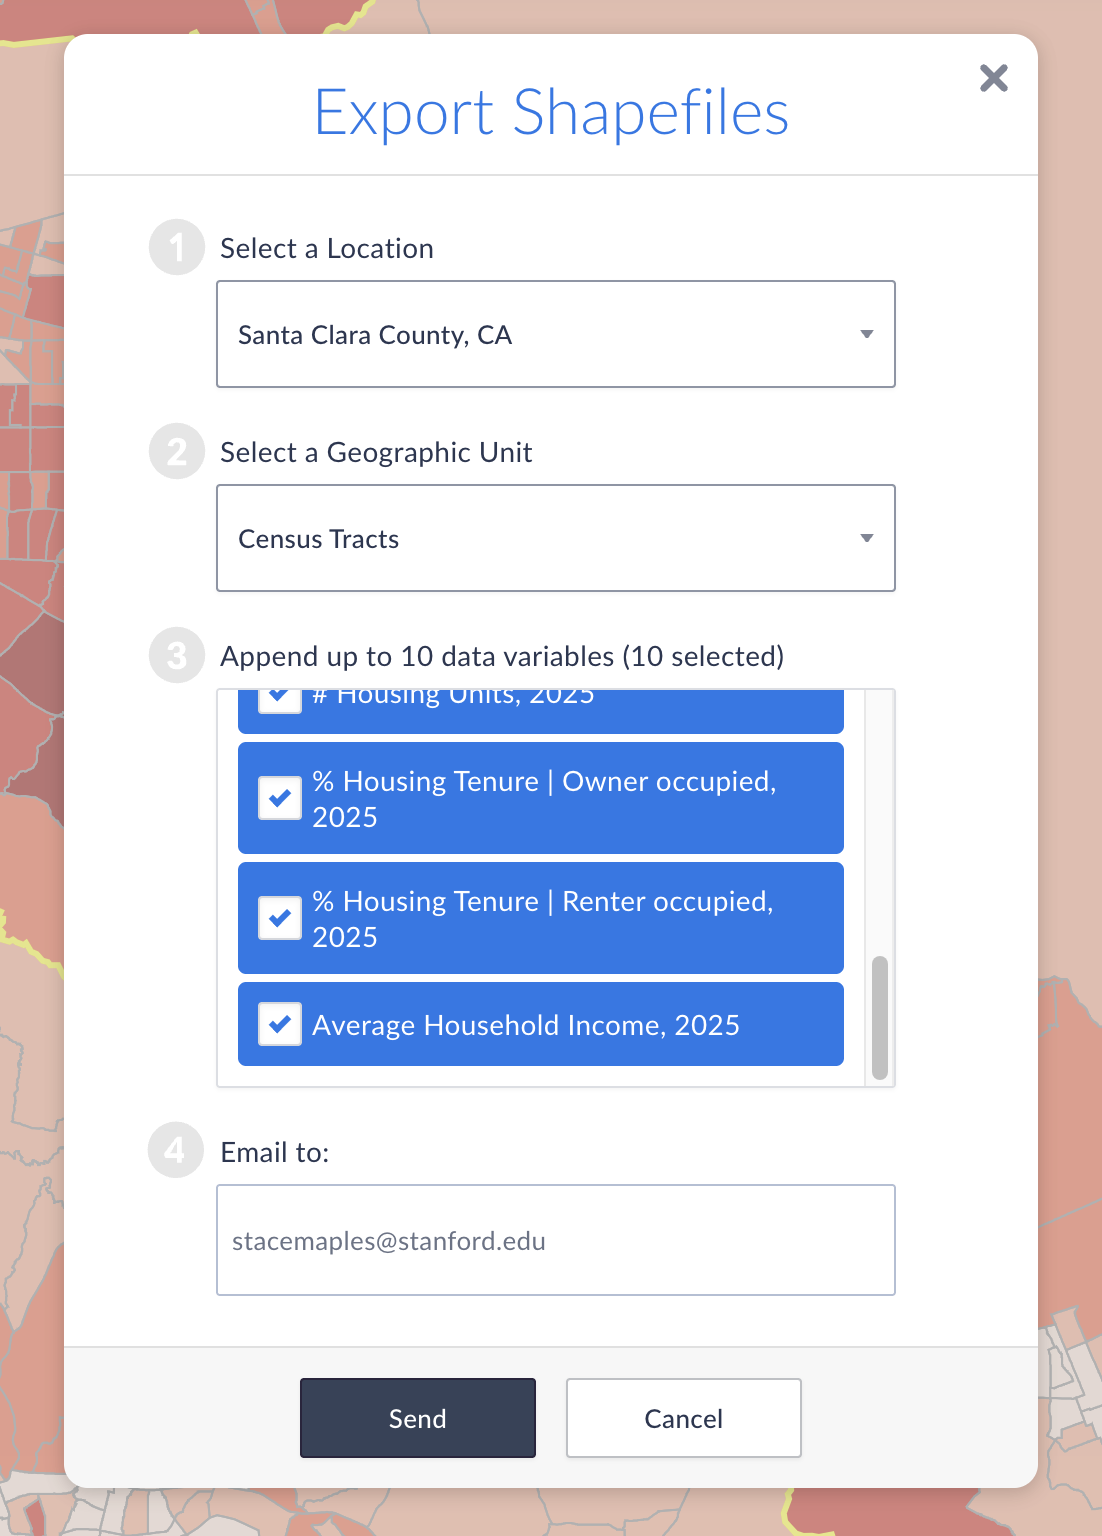
In the Export Shapefiles dialog:
- Select a Location (example: Santa Clara County, CA).
- Select a Geographic Unit (example: Census Tracts).
- Append up to 10 data variables (check the ones you want included as attributes).
- Confirm the Email to: field is correct.
- Click Send.
10) Download and use the shapefile
- Check your email for the export message from SimplyAnalytics.
- Download the attached file or linked download (commonly a
.zip). - Unzip it—you should see the standard shapefile components (typically
.shp,.shx,.dbf, and.prj). Add the
.shpto your GIS (ArcGIS Pro/QGIS).- If anything looks “in the wrong place,” confirm the
.prjcame through and the CRS is being recognized.Example: Santa Clara County Census Tracts Dataset
- If anything looks “in the wrong place,” confirm the
Original exported filename:
SimplyAnalytics_Shapefiles_a697ee0b73511873a2a00b2ca24a0b385591024499fbc67070322d874d17bbc8.zip
Renamed for clarity:
Santa_Clara_Census_Tracts.shp
Downloaded files include:
Santa_Clara_Census_Tracts.shp— geometry (polygons for each census tract)Santa_Clara_Census_Tracts.shx— spatial indexSanta_Clara_Census_Tracts.dbf— attribute table with 10 demographic variablesSanta_Clara_Census_Tracts.prj— projection information (typically WGS84/EPSG:4326)Santa_Clara_Census_Tracts_variable_names.txt— lookup table for variable meanings
Variable names and descriptions (from variable_names.txt):
VALUE0  # Total Population, 2025
VALUE1  % Age | 65 years and over, 2025
VALUE2  % Educational Attainment | Bachelor's degree or higher, 2025
VALUE3  Median Household Income, 2025
VALUE4  % Household Income | $100,000 or more, 2025
VALUE5  Average Per Capita Income, 2025
VALUE6  # Housing Units, 2025
VALUE7  % Housing Tenure | Owner occupied, 2025
VALUE8  % Housing Tenure | Renter occupied, 2025
VALUE9  Average Household Income, 2025
Key notes:
- Cryptic original filename: SimplyAnalytics generates long hash-based filenames—rename for sanity
- VALUE0-VALUE9: Generic column names in the DBF attribute table; use the
variable_names.txtto decode - 10 variable limit: This export includes the maximum (10 variables); additional exports needed for more variables
- 2025 data: Future-projected estimates based on Census Bureau data and SimplyAnalytics models
Notes and common gotchas
- Variable limit: The export supports up to 10 appended variables per shapefile export (as shown in the dialog).
- Attribute naming: Long variable names may be shortened in the shapefile attribute table—this is a shapefile limitation, not you doing something wrong.
- Repeatable workflow: If you need more than 10 variables, export multiple shapefiles and join them later using the shared geographic ID (tract/ZIP identifier).