Step 2: Initialize Leaflet Map
Live Demo: html/cog_map_step_02.html
Overview
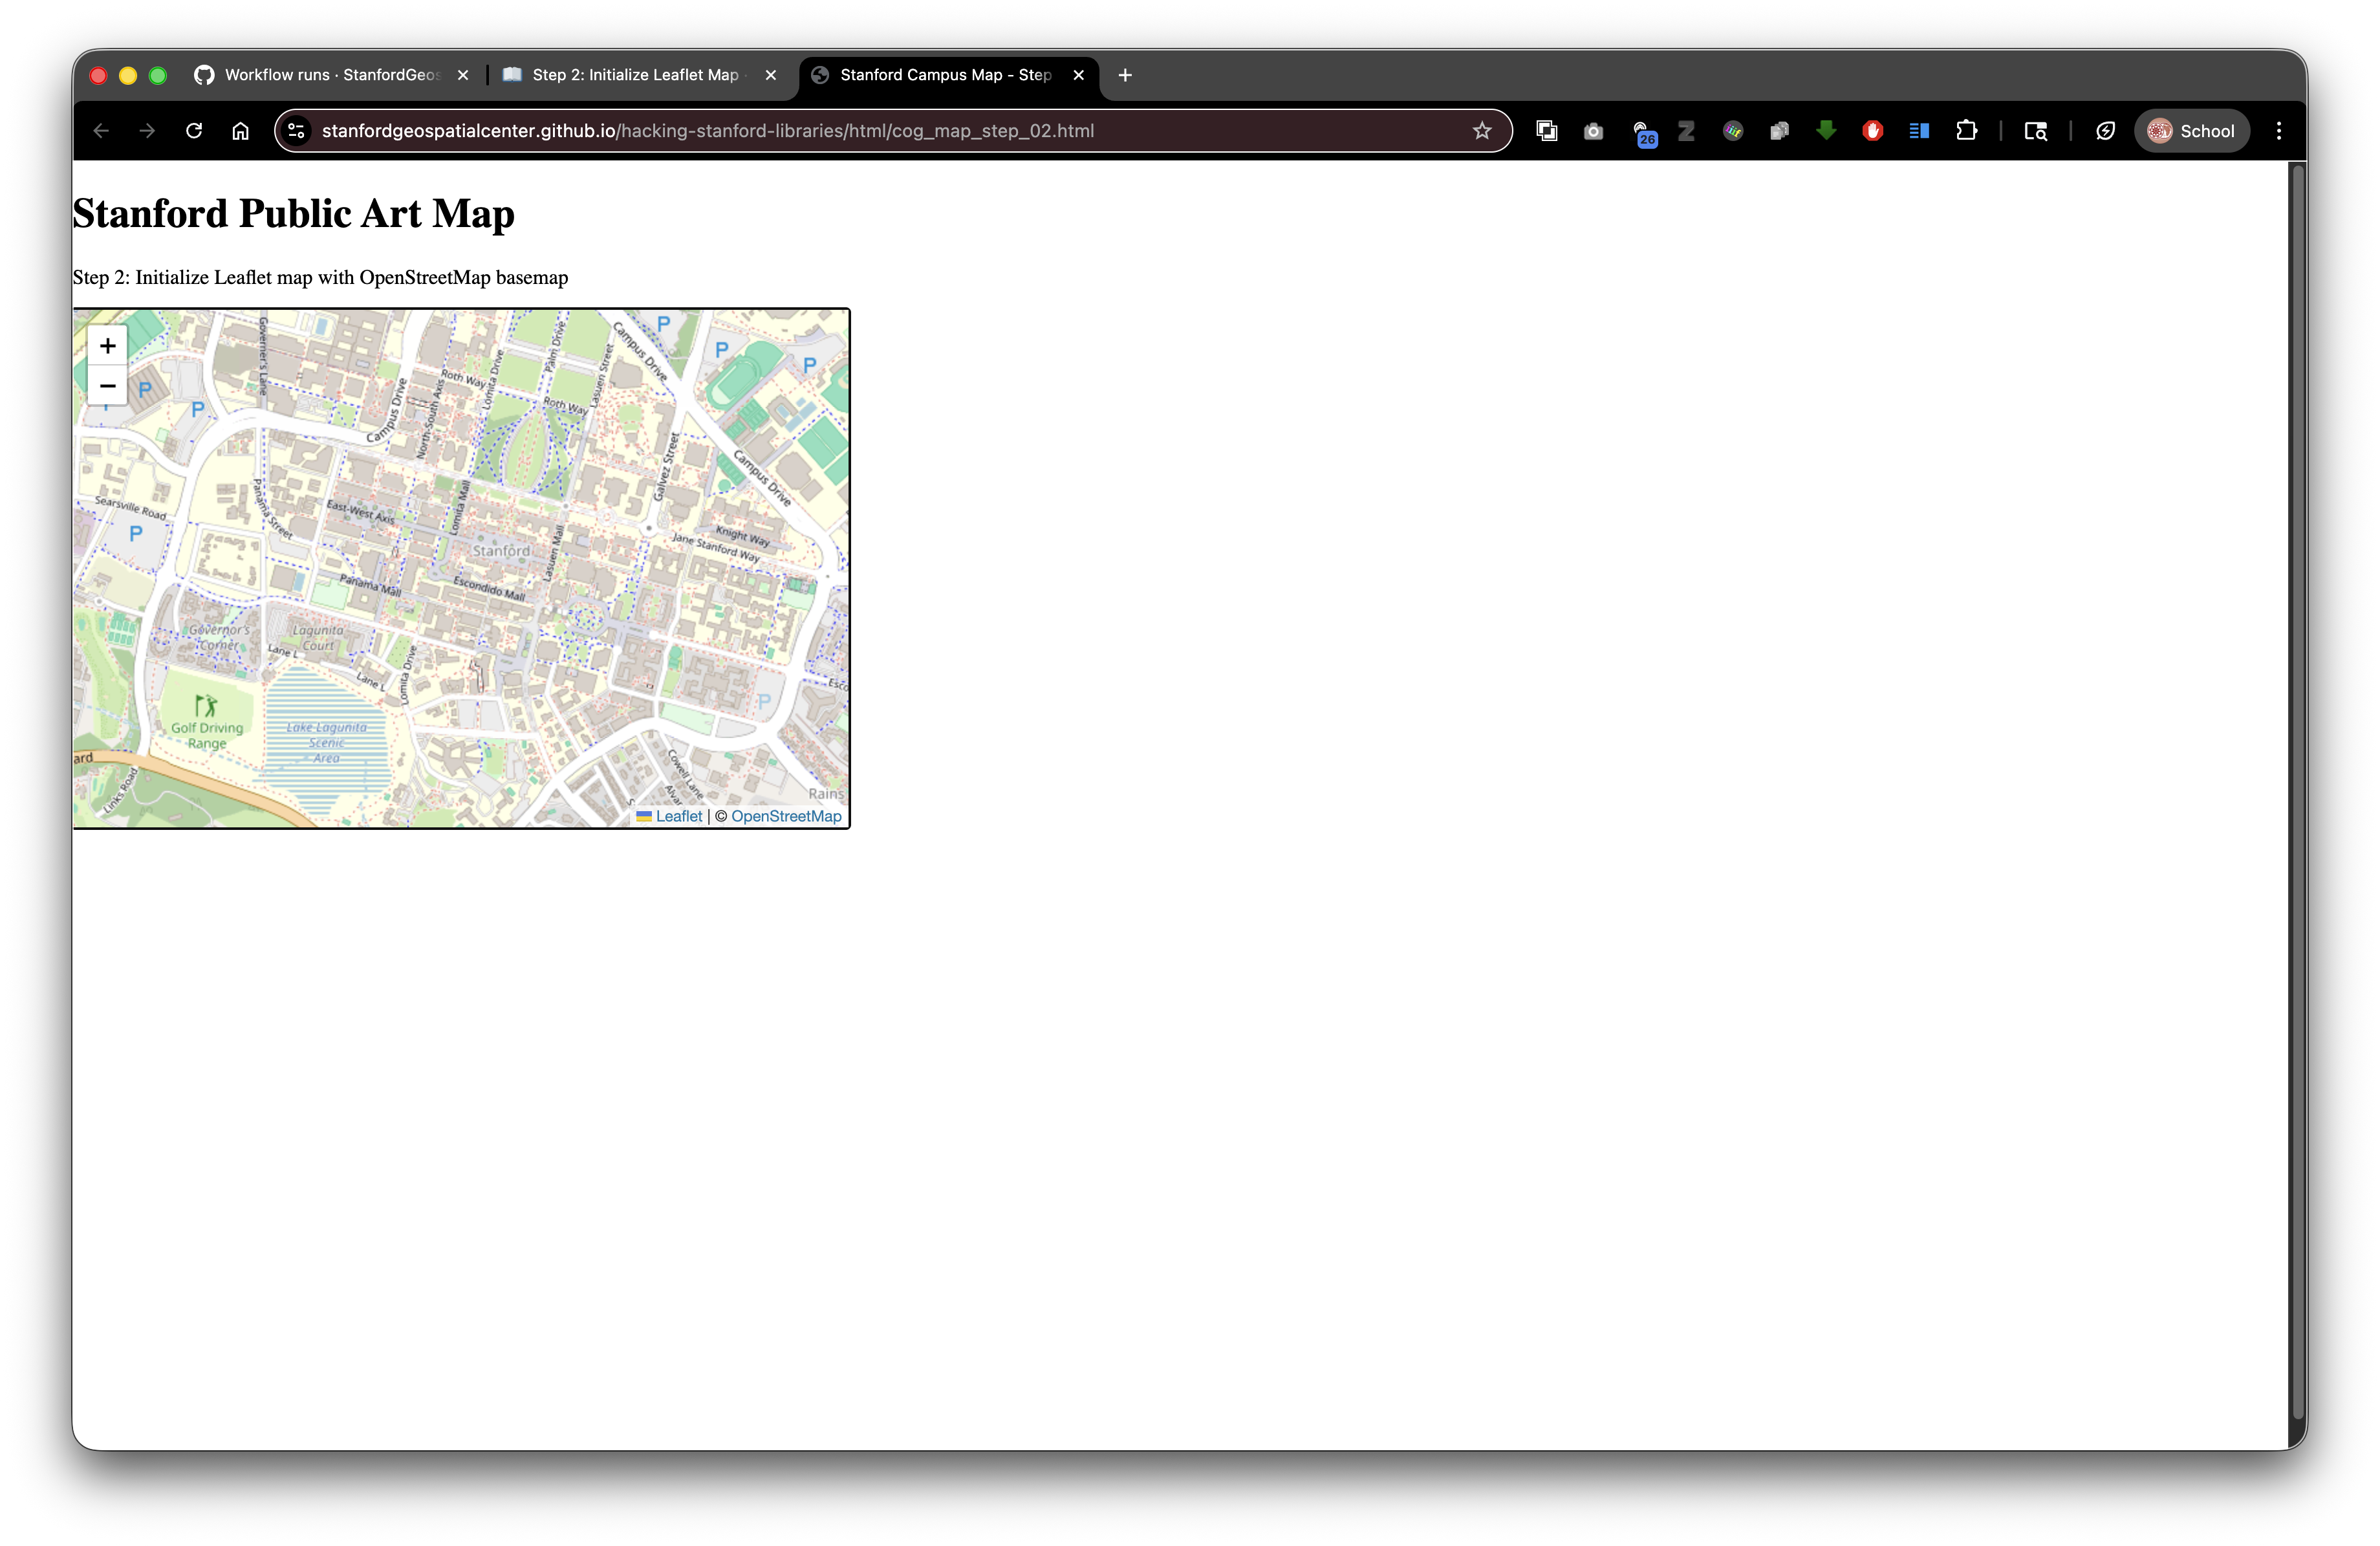
Now we'll transform our empty container into an interactive web map using Leaflet, a popular open-source JavaScript mapping library.
Learning Objectives
- Understand how to include external JavaScript libraries
- Learn about CDNs (Content Delivery Networks)
- Create your first interactive map
- Understand the basics of JavaScript
- Learn about map coordinates and zoom levels
What is Leaflet?
Leaflet is a JavaScript library for creating interactive maps. It's:
- Free and open-source
- Lightweight (only 42KB)
- Works on all major browsers
- Mobile-friendly
- Easy to use
Think of it like a toolkit - it provides all the functions you need to create maps without building everything from scratch.
The Complete Code
<!DOCTYPE html>
<html lang="en">
<head>
<base target="_top">
<meta charset="utf-8">
<meta name="viewport" content="width=device-width, initial-scale=1">
<title>Stanford Campus Map - Step 2: Add Leaflet Map</title>
<link rel="stylesheet" href="https://unpkg.com/leaflet@1.9.4/dist/leaflet.css" integrity="sha256-p4NxAoJBhIIN+hmNHrzRCf9tD/miZyoHS5obTRR9BMY=" crossorigin=""/>
<script src="https://unpkg.com/leaflet@1.9.4/dist/leaflet.js" integrity="sha256-20nQCchB9co0qIjJZRGuk2/Z9VM+kNiyxNV1lvTlZBo=" crossorigin=""></script>
<style>
    html, body {
        height: 100%;
        margin: 0;
    }
    .leaflet-container {
        height: 400px;
        width: 600px;
        max-width: 100%;
        max-height: 100%;
    }
</style>
</head>
<body>
<h1>Stanford Public Art Map</h1>
<p>Step 2: Initialize Leaflet map with OpenStreetMap basemap</p>
<div id="map" style="width: 600px; height: 400px;"></div>
<script>
// Initialize map centered on Stanford campus
const map = L.map('map').setView([37.427, -122.169], 15);
// Add OpenStreetMap tile layer
const tiles = L.tileLayer('https://tile.openstreetmap.org/{z}/{x}/{y}.png', {
maxZoom: 19,
attribution: '© <a href="http://www.openstreetmap.org/copyright">OpenStreetMap</a>'
}).addTo(map);
</script>
</body>
</html>
What's New?
1. Leaflet CSS (Stylesheet)
<link rel="stylesheet" href="https://unpkg.com/leaflet@1.9.4/dist/leaflet.css" integrity="sha256-p4NxAoJBhIIN+hmNHrzRCf9tD/miZyoHS5obTRR9BMY=" crossorigin=""/>
What it does: Loads the Leaflet CSS file that styles the map controls (zoom buttons, attribution, etc.)
Breaking it down:
<link rel="stylesheet">- Tell the browser we're loading a CSS filehref="https://unpkg.com/..."- The location of the file (a CDN)integrity="sha256-..."- Security check to ensure the file wasn't tampered withcrossorigin=""- Allows loading from a different domain
What is unpkg.com? ACDN (Content Delivery Network)that hosts JavaScript libraries. Benefits:
- Fast delivery from servers around the world
- Libraries are cached by browsers (faster repeat visits)
- No need to download and host files yourself
Alternative (for SDR deposits): You can download leaflet.css and include it in your deposit, then use a relative path:
<link rel="stylesheet" href="lib/leaflet.css">
2. Leaflet JavaScript Library
<script src="https://unpkg.com/leaflet@1.9.4/dist/leaflet.js" integrity="sha256-20nQCchB9co0qIjJZRGuk2/Z9VM+kNiyxNV1lvTlZBo=" crossorigin=""></script>
What it does: Loads the Leaflet JavaScript library that provides all the mapping functions
The <script> tag: Used to include JavaScript code or JavaScript files
Two ways to use <script>:
- External file (like this):
<script src="filename.js"></script> - Inline code (like we'll use below):
<script>code goes here</script>
3. Internal CSS (Style Block)
<style>
html, body {
    height: 100%;
    margin: 0;
}
.leaflet-container {
    height: 400px;
    width: 600px;
    max-width: 100%;
    max-height: 100%;
}
</style>
What it does: Adds custom styling for the page
Breaking it down:
html, body {
height: 100%;
margin: 0;
}
html, body- Applies these styles to both elementsheight: 100%- Make them fill the full browser window heightmargin: 0- Remove default margins (no gaps at edges)
.leaflet-container {
height: 400px;
width: 600px;
max-width: 100%;
max-height: 100%;
}
.leaflet-container- Styles any element with class="leaflet-container" (Leaflet adds this automatically)height: 400px; width: 600px;- Set specific dimensionsmax-width: 100%; max-height: 100%- Don't exceed the browser window size (important for mobile)
4. JavaScript Code to Create the Map
This is where the magic happens! Let's break it down line by line:
// Initialize map centered on Stanford campus
const map = L.map('map').setView([37.427, -122.169], 15);
JavaScript comments: Lines starting with // are comments (notes for humans, ignored by computer)
Breaking down the code:
const- Declares a constant variable (a container for a value that won't change)map- The name we're giving to our variable=- Assignment operator (store the value on the right into the variable on the left)L.map('map')- Call Leaflet's map function, targeting the element with id="map".setView([37.427, -122.169], 15)- Set the initial map view
Understanding .setView():
.setView([latitude, longitude], zoomLevel)
- Latitude: 37.427 (Stanford's position north of the equator)
- Longitude: -122.169 (Stanford's position west of the prime meridian)
- Zoom level: 15 (0 = whole world, 19 = maximum detail)
Geographic Coordinates Explained:
- Latitude: -90 (South Pole) to +90 (North Pole)
- Longitude: -180 to +180 (wraps around the globe)
- Stanford is at approximately 37.427°N, 122.169°W
Finding coordinates for your location:
- Go to Google Maps
- Right-click on a location
- Click the coordinates that appear
- Format as
[latitude, longitude]
5. Adding the Base Map Tiles
// Add OpenStreetMap tile layer
const tiles = L.tileLayer('https://tile.openstreetmap.org/{z}/{x}/{y}.png', {
maxZoom: 19,
attribution: '© <a href="http://www.openstreetmap.org/copyright">OpenStreetMap</a>'
}).addTo(map);
What are tiles? Web maps are made of small square images (tiles) arranged like a grid. As you zoom and pan, new tiles load.
The URL pattern:
https://tile.openstreetmap.org/{z}/{x}/{y}.png
Options object (inside the {}):
maxZoom: 19- Maximum zoom level available for these tilesattribution: '...'- Credits for the map data (required by OpenStreetMap license)
.addTo(map) - Adds this tile layer to our map
Using Digital Stacks Tiles
You can also use tiles hosted in SDR! For example:
const tiles = L.tileLayer('collection/tiles/{z}/{x}/{y}.png', {
    maxZoom: 18,
    attribution: 'Stanford Libraries'
}).addTo(map);
This is a relative path! It looks for:
your-project/
├── index.html (your HTML file)
└── collection/
    └── tiles/
        ├── 0/    (zoom level 0)
        ├── 1/    (zoom level 1)
        └── ...
When deposited to SDR with DRUID abc123xyz456, the tiles become accessible at:
https://stacks.stanford.edu/file/druid:abc123xyz456/collection/tiles/15/5280/12795.png
How JavaScript Works in HTML
JavaScript code executes when the browser encounters it. Our script is at the bottom of the <body> because:
- The HTML needs to load first (the
<div id="map">must exist) - Then JavaScript can find that div and put a map in it
Order matters! This won't work:
<script>
  const map = L.map('map');  // Error! div doesn't exist yet
</script>
<div id="map"></div>
This works:
<div id="map"></div>
<script>
  const map = L.map('map');  // Success! div already exists
</script>
Try It Yourself
- Copy the complete code into a new file called
step-02.html - Save and open in your browser
- You should see: An interactive map centered on Stanford campus!
Test the interactivity:
- Click and drag to pan around
- Scroll wheel or use + / - buttons to zoom in and out
- Double-click to zoom in on a specific spot
Experiments
Change the starting location to your hometown:
const map = L.map('map').setView([YOUR_LAT, YOUR_LONG], 12);
Change the zoom level (try values from 1 to 19):
.setView([37.427, -122.169], 5);  // Zoomed way out
.setView([37.427, -122.169], 18); // Zoomed way in
Try different tile providers:
Satellite imagery:
const tiles = L.tileLayer('https://server.arcgisonline.com/ArcGIS/rest/services/World_Imagery/MapServer/tile/{z}/{y}/{x}', {
    attribution: 'Esri'
}).addTo(map);
Connection to Digital Stacks
When you deposit this HTML to the Stanford Digital Repository (SDR):
External libraries (Leaflet from unpkg.com) continue to work - no problem with absolute URLs!
Your own tiles should use relative paths so they work after deposit
Example SDR deposit structure:
Your Object (druid:abc123xyz456)
├── index.html
└── tiles/
 ├── 12/
 ├── 13/
 ├── 14/
 └── ...
Related resources:
- Stanford Digital Repository: https://sdr.stanford.edu/
- Stanford Libraries APIs: https://api.library.stanford.edu/
Stanford Geospatial Center: https://gis.stanford.edu/
Your HTML references tiles:
L.tileLayer('tiles/{z}/{x}/{y}.png')After deposit, tiles are accessible at:
https://stacks.stanford.edu/file/druid:abc123xyz456/tiles/14/2695/6328.png
What's Next?
In Step 3: Load GeoJSON Points, we'll add data points (artwork locations) to our map!
Key Takeaways
- External libraries can be loaded from CDNs using
<link>and<script>tags - Leaflet makes it easy to create interactive maps
- Maps need center coordinates
[latitude, longitude]and a zoom level - Tile layers provide the base map imagery
- JavaScript at the bottom of
<body>runs after HTML loads - Relative paths work great for tiles in SDR deposits
Common Questions
Q: Do I need an internet connection?
A: Yes, if using tiles from OpenStreetMap or libraries from CDNs. For offline use, download and include everything locally.
Q: Can I use my own tiles?
A: Yes! Generate tiles with tools like GDAL and reference them with relative paths.
Q: Why use unpkg.com instead of downloading Leaflet?
A: CDNs are faster and users might have it cached. But for SDR deposits, downloading and including locally ensures it always works.
Previous: Step 1: Map Container | Next: Step 3: GeoJSON Points