Step 3: Load GeoJSON Points
Live Demo: html/cog_map_step_03.html
Overview
In this step, we'll add data points (artwork locations) to our map by loading a GeoJSON file. This introduces working with geographic data and customizing how markers appear.
Learning Objectives
- Understand what GeoJSON is and why it's useful
- Learn how to load external data files with
fetch() - Create custom markers instead of default pins
- Work with feature properties (attributes)
- Transform default markers into styled circles
What is GeoJSON?
GeoJSON is a format for encoding geographic data usingJSON (JavaScript Object Notation).
Think of it like: A spreadsheet (with rows of data and columns of attributes) that also knows where things are located on Earth.
Why Use GeoJSON?
- Human-readable - You can open it in a text editor and understand it
- Widely supported - Works with almost every mapping library and GIS software
- Combines geometry and attributes - Location + information in one file
- Web-friendly - Native JavaScript format, easy to work with
- Flexible - Can represent points, lines, polygons, and more
GeoJSON Structure
A simple GeoJSON file looks like this:
{
  "type": "FeatureCollection",
  "features": [
    {
      "type": "Feature",
      "geometry": {
        "type": "Point",
        "coordinates": [-122.1656846, 37.425345]
      },
      "properties": {
        "name": "The Sieve of Eratosthenes",
        "artist_name": "Mark di Suvero",
        "artwork_type": "sculpture",
        "wikidata": "Q47522966"
      }
    }
  ]
}
Breaking it down:
- FeatureCollection: A container holding multiple features
- Features: Individual geographic objects (one artwork in this case)
- Geometry: The location and shape
- type: "Point" (could also be LineString, Polygon, etc.)
- coordinates:
[longitude, latitude]- NOTE: Longitude comes first in GeoJSON!
- Properties: Attributes/information about this feature (like columns in a spreadsheet)
The Complete Code
<!DOCTYPE html>
<html lang="en">
<head>
<base target="_top">
<meta charset="utf-8">
<meta name="viewport" content="width=device-width, initial-scale=1">
<title>Stanford Campus Map - Step 3: Add GeoJSON Points</title>
<link rel="stylesheet" href="https://unpkg.com/leaflet@1.9.4/dist/leaflet.css" integrity="sha256-p4NxAoJBhIIN+hmNHrzRCf9tD/miZyoHS5obTRR9BMY=" crossorigin=""/>
<script src="https://unpkg.com/leaflet@1.9.4/dist/leaflet.js" integrity="sha256-20nQCchB9co0qIjJZRGuk2/Z9VM+kNiyxNV1lvTlZBo=" crossorigin=""></script>
<style>
html, body {
height: 100%;
margin: 0;
}
.leaflet-container {
height: 400px;
width: 600px;
max-width: 100%;
max-height: 100%;
}
</style>
</head>
<body>
<h1>Stanford Public Art Map</h1>
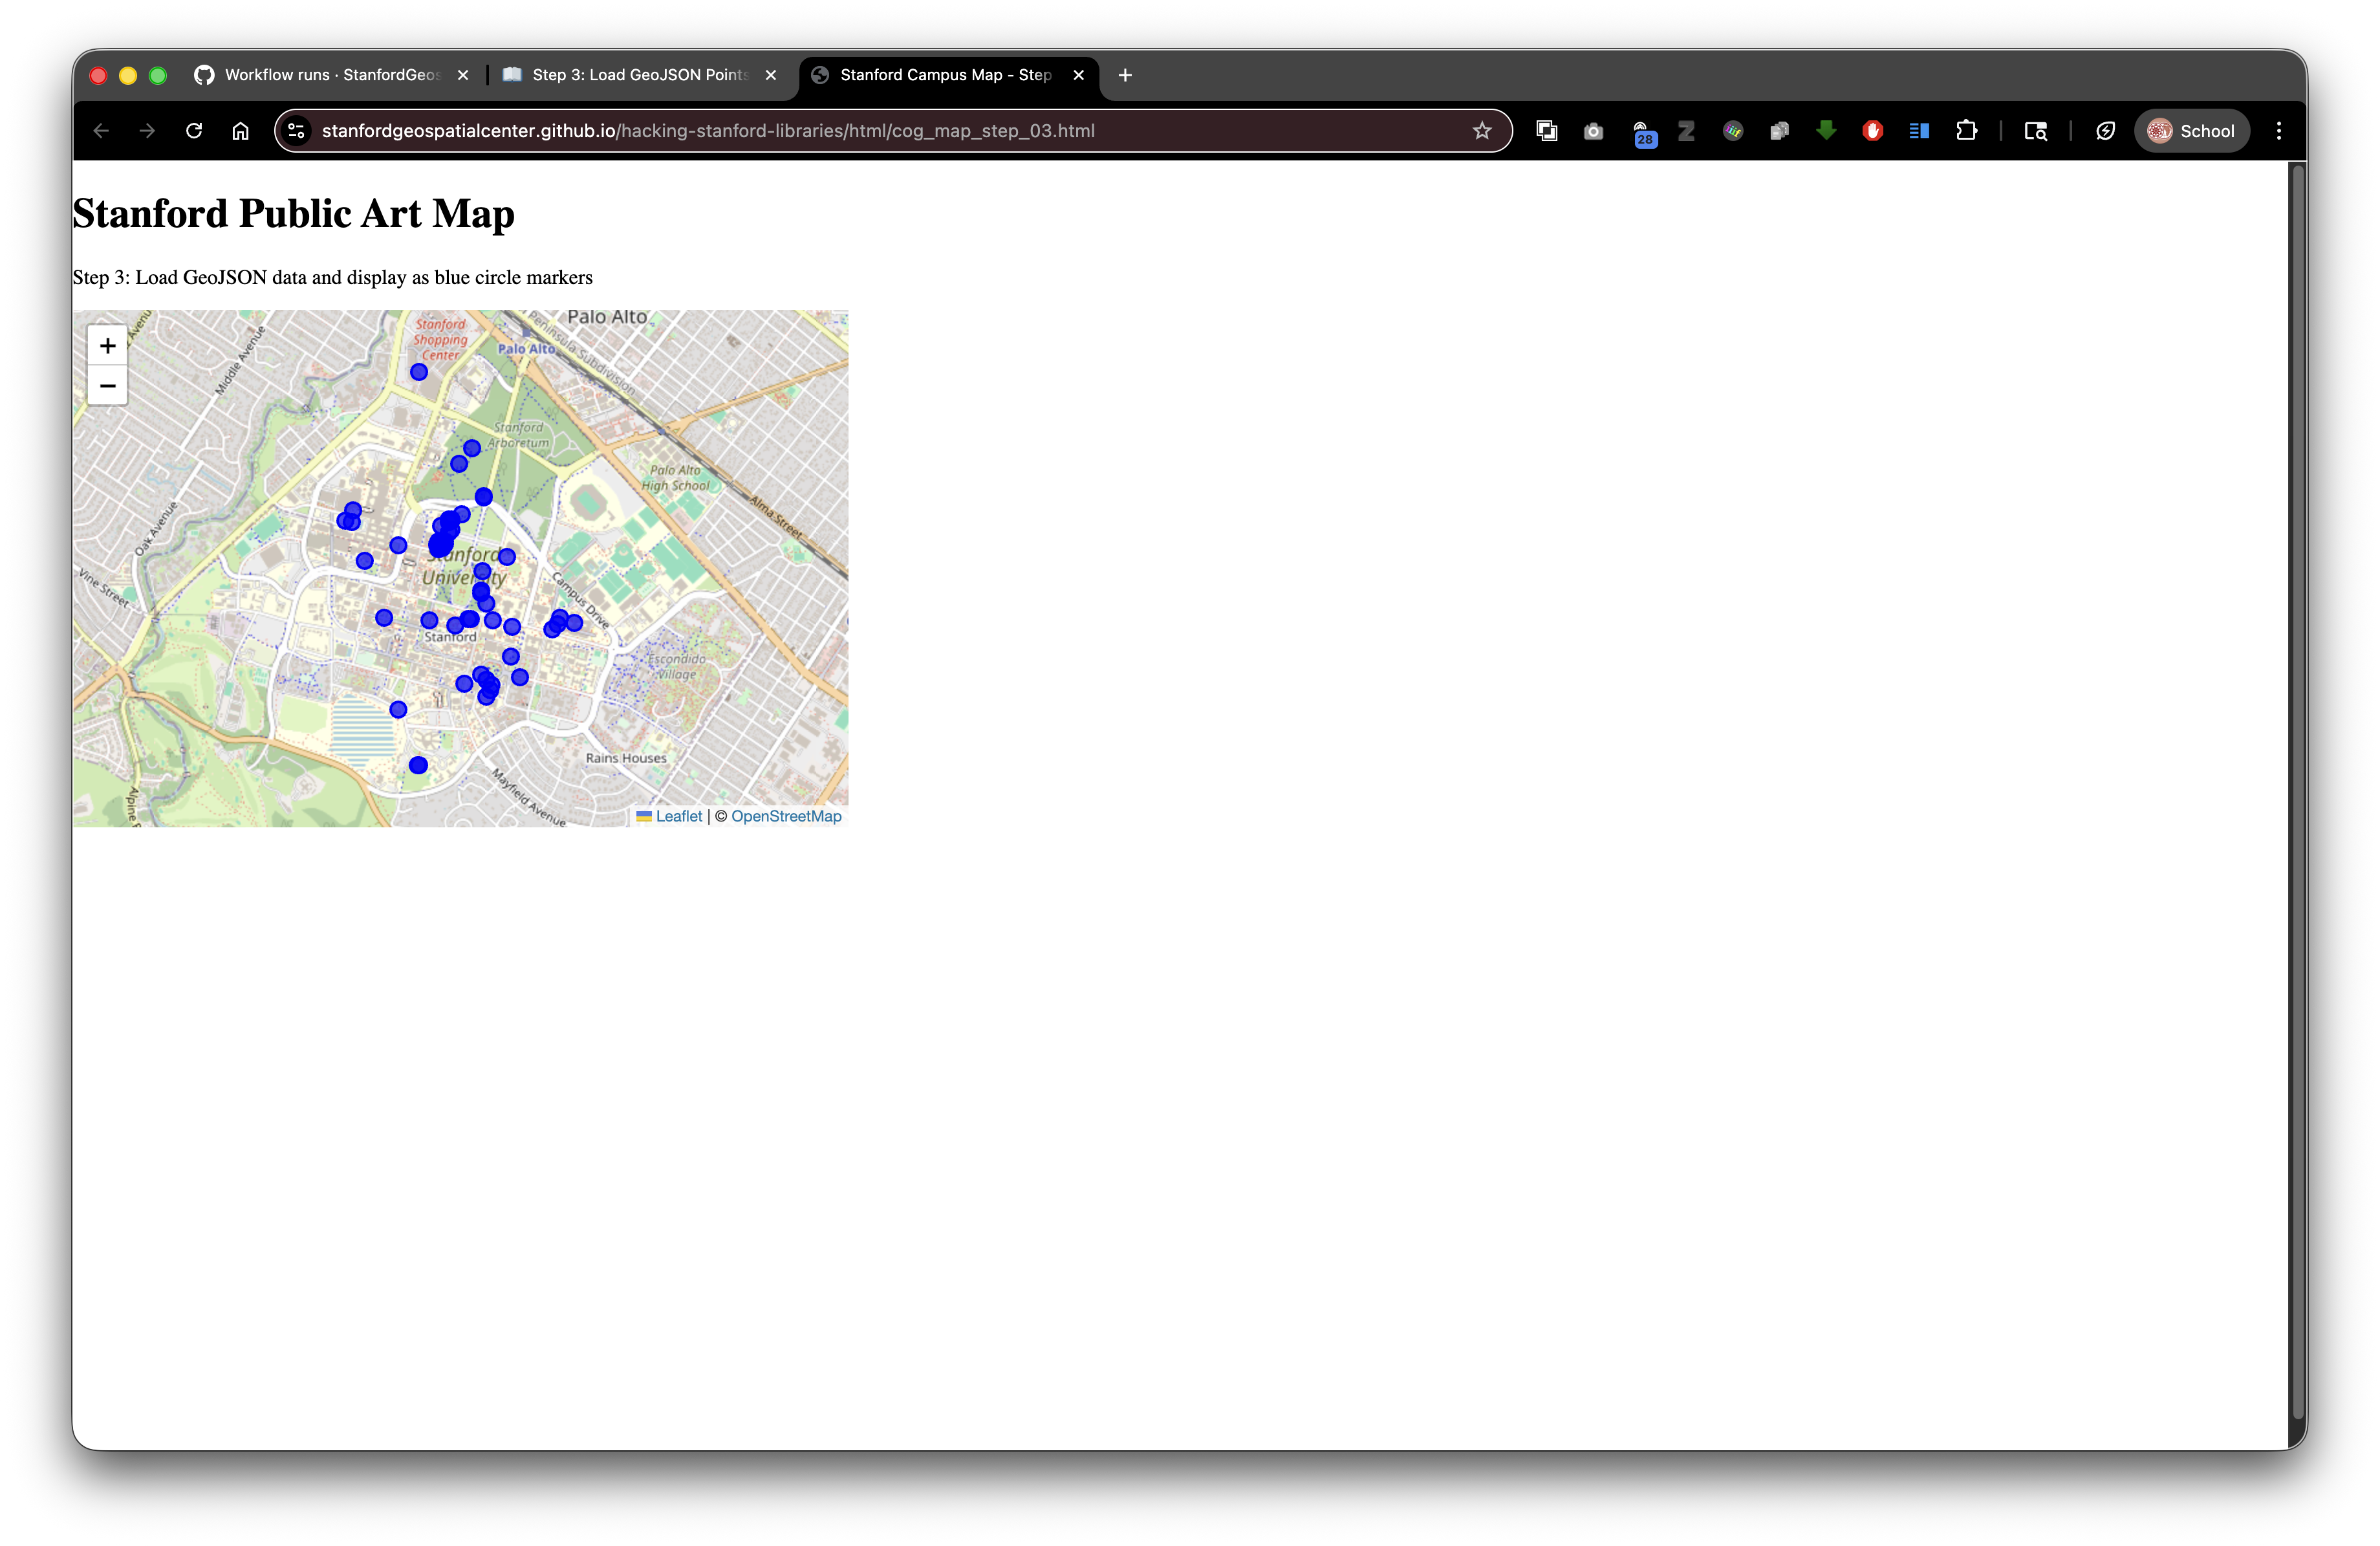
<p>Step 3: Load GeoJSON data and display as blue circle markers</p>
<div id="map" style="width: 600px; height: 400px;"></div>
<script>
// Initialize map centered on Stanford campus
const map = L.map('map').setView([37.427, -122.169], 15);
// Add OpenStreetMap tile layer
const tiles = L.tileLayer('https://tile.openstreetmap.org/{z}/{x}/{y}.png', {
maxZoom: 19,
attribution: '© <a href="http://www.openstreetmap.org/copyright">OpenStreetMap</a>'
}).addTo(map);
// Load GeoJSON data
fetch('../stanford_public_art.geojson')
.then(response => response.json())
.then(data => {
// Add GeoJSON layer with custom circle markers
const artworkLayer = L.geoJSON(data, {
pointToLayer: function(feature, latlng) {
return L.circleMarker(latlng, {
radius: 6,
color: 'blue',
weight: 2,
fillColor: 'blue',
fillOpacity: 0.7
});
}
}).addTo(map);
// Zoom to fit all markers
map.fitBounds(artworkLayer.getBounds());
})
.catch(error => console.error('Error loading GeoJSON:', error));
</script>
</body>
</html>
What's New?
1. The Fetch API
fetch('../stanford_public_art.geojson')
What is fetch()? A built-in JavaScript function for loading files from URLs (local or remote).
This is a relative path! Looking for:
your-project/
├── stanford_public_art.geojson (the data file)
└── html/
    └── cog_map_step_03.html (this file)
In Digital Stacks (after deposit to SDR):
https://stacks.stanford.edu/file/druid:abc123xyz456/
├── stanford_public_art.geojson
└── html/
    └── index.html
The relative path ../stanford_public_art.geojson works in both locations!
You could also use an absolute Digital Stacks URL:
fetch('https://stacks.stanford.edu/file/druid:abc123xyz456/stanford_public_art.geojson')
2. Promises and .then() Chains
fetch('file.geojson')
    .then(response => response.json())
    .then(data => {
        // Use the data here
    })
    .catch(error => console.error('Error:', error));
What's happening here?
Think of it like ordering a package:
fetch()- Place the order (start downloading the file).then(response => response.json())- Package arrives, open it and read the contents.then(data => { ... })- Use what was inside.catch(error => ...)- Handle problems (file not found, network error, etc.)
Why .then() chains?
JavaScript doesn't wait for files to download. It continues running other code. .then() says "when the download finishes, THEN do this."
Arrow functions: The => syntax is a shorter way to write functions:
// Traditional function
function(response) { return response.json(); }

// Arrow function (equivalent)
response => response.json()
3. Parsing JSON
.then(response => response.json())
What this does: Converts the text file into a JavaScript object you can work with.
Without .json(): You'd just have a string of text
With .json(): You have a structured object with properties you can access
4. Creating a GeoJSON Layer
const artworkLayer = L.geoJSON(data, {
    pointToLayer: function(feature, latlng) {
        return L.circleMarker(latlng, {
            radius: 6,
            color: 'blue',
            weight: 2,
            fillColor: 'blue',
            fillOpacity: 0.7
        });
    }
}).addTo(map);
Breaking it down:
L.geoJSON(data, options) - Leaflet's built-in function to display GeoJSON
Parameters:
5. Custom Point Styling with pointToLayer
pointToLayer: function(feature, latlng) {
    return L.circleMarker(latlng, {
        radius: 6,
        color: 'blue',
        weight: 2,
        fillColor: 'blue',
        fillOpacity: 0.7
    });
}
What is pointToLayer? A function that tells Leaflet how to draw each point.
Default behavior (without this): Leaflet uses blue pin markers
With this: We create custom circle markers
Parameters passed to the function:
feature- The current GeoJSON feature (one artwork)latlng- The coordinates as a Leaflet LatLng object
What to return: A Leaflet layer (marker, circle, etc.)
6. Circle Marker Styling
L.circleMarker(latlng, {
    radius: 6,
    color: 'blue',
    weight: 2,
    fillColor: 'blue',
    fillOpacity: 0.7
})
Style options explained:
radius: 6- Size in pixels (not meters!), stays same size when zoomingcolor: 'blue'- Border/outline colorweight: 2- Border thickness in pixelsfillColor: 'blue'- Interior colorfillOpacity: 0.7- Transparency (0 = invisible, 1 = solid)
Colors can be:
- Named:
'red','blue','green' - Hex codes:
'#FF0000'(red),'#0000FF'(blue) - RGB:
'rgb(255, 0, 0)'
Circle vs. CircleMarker:
L.circle()- Size in meters, grows/shrinks with zoomL.circleMarker()- Size in pixels, stays constant
7. Fitting Bounds
map.fitBounds(artworkLayer.getBounds());
What this does: Automatically zooms and centers the map to show all markers.
artworkLayer.getBounds() - Calculates the bounding box (rectangle) that contains all features
map.fitBounds() - Adjusts the map view to show that rectangle
Why use it: Instead of manually guessing zoom and center, let Leaflet calculate the best view.
8. Error Handling
.catch(error => console.error('Error loading GeoJSON:', error));
What this does: If anything goes wrong (file not found, invalid JSON, network error), log the error to the console.
To see errors: Press F12 in your browser to open Developer Tools, click Console tab.
Understanding Feature and Properties
Each point in your GeoJSON has properties you can access:
pointToLayer: function(feature, latlng) {
    console.log(feature.properties.name);  // "The Sieve of Eratosthenes"
    console.log(feature.properties.artist_name);  // "Mark di Suvero"
    console.log(feature.properties.wikidata);  // "Q47522966"

    return L.circleMarker(latlng, { ... });
}
feature.properties - An object containing all the attributes from the GeoJSON
In the next step, we'll use these properties to create informative popups!
GeoJSON in Digital Stacks
Local Development
Your file structure:
project/
├── stanford_public_art.geojson
└── html/
    └── index.html
Your code (in html/index.html):
fetch('../stanford_public_art.geojson')
After SDR Deposit (DRUID: abc123xyz456)
Files at:
https://stacks.stanford.edu/file/druid:abc123xyz456/stanford_public_art.geojson
https://stacks.stanford.edu/file/druid:abc123xyz456/html/index.html
Your relative path still works! No changes needed.
Referencing External GeoJSON
You can also load GeoJSON from other DRUIDs:
fetch('https://stacks.stanford.edu/file/druid:xyz789def123/boundaries.geojson')
Use case: Build a collection viewer that combines data from multiple SDR deposits.
Try It Yourself
- Copy the complete code into
html/step-03.html - Make sure
stanford_public_art.geojsonexists at the root level (not in a collection/ folder) - Open in your browser
You should see blue circles at artwork locations!
Experiments
Change marker colors:
color: 'red',
fillColor: 'orange'
Make markers larger:
radius: 10
Make them transparent:
fillOpacity: 0.3
Add a white border:
color: 'white',
weight: 3,
fillColor: 'blue'
Color by artwork type:
pointToLayer: function(feature, latlng) {
    const color = feature.properties.artwork_type === 'sculpture' ? 'blue' : 'red';
    return L.circleMarker(latlng, {
        radius: 6,
        fillColor: color,
        fillOpacity: 0.7
    });
}
Creating Your Own GeoJSON
Option 1: GeoJSON.io
- Go to http://geojson.io/
- Draw points, lines, or polygons on the map
- Add properties in the table
- Download the GeoJSON file
- Add to your project's root folder (or wherever your HTML file expects it)
Option 2: Export from GIS Software
- QGIS: Layer → Save As → GeoJSON
- ArcGIS: Export Features → JSON
- R:
st_write(data, "file.geojson", driver = "GeoJSON")
Option 3: Write by Hand
{
  "type": "FeatureCollection",
  "features": [
    {
      "type": "Feature",
      "geometry": {
        "type": "Point",
        "coordinates": [-122.169, 37.427]
      },
      "properties": {
        "name": "My Location",
        "description": "Something interesting"
      }
    }
  ]
}
Common Mistakes
❌ Wrong coordinate order:
"coordinates": [37.427, -122.169] // Wrong! Latitude first
- Correct:
"coordinates": [-122.169, 37.427] // Right! Longitude first
❌ Forgetting to add to map:
const artworkLayer = L.geoJSON(data, { ... });
// Missing: .addTo(map)
❌ Using wrong path:
fetch('stanford_public_art.geojson') // Won't find it if HTML is in html/ subdirectory
✅ Correct (when HTML is in html/ subdirectory):
fetch('../stanford_public_art.geojson') // Go up one level to find the file
What's Next?
In Step 4: Add Popups, we'll make these markers interactive by adding popups that display artwork information when clicked!
Key Takeaways
- GeoJSON combines location data with attributes
fetch()loads files asynchronously.then()chains handle asynchronous operationspointToLayercustomizes how points are displayed- Circle markers can be styled with colors, sizes, and opacity
fitBounds()automatically centers the map on your data- Relative paths work perfectly in SDR deposits
Common Questions
Q: Why do coordinates show [longitude, latitude] in GeoJSON but [latitude, longitude] in Leaflet?
A: GeoJSON follows the (x, y) convention, treating longitude as x and latitude as y. Leaflet uses geographic convention (lat, lng). Leaflet handles the conversion automatically.
Q: Can I load GeoJSON from a URL?
A: Yes! fetch() works with any URL, including Digital Stacks URLs.
Q: What if my GeoJSON is invalid?
A: You'll see an error in the console. Validate your GeoJSON at http://geojson.io/ or https://geojsonlint.com/
Q: Can I use other geometry types?
A: Yes! GeoJSON supports Points, LineStrings, Polygons, and more. Leaflet will draw them automatically.
Previous: Step 2: Initialize Map | Next: Step 4: Add Popups